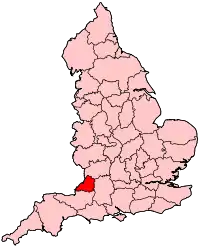
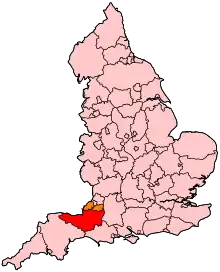
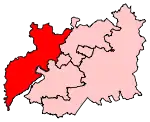
The region[1] of South West England has, since the 2010 general election, 55 parliamentary constituencies which is made up of 15 borough constituencies and 40 county constituencies. At that election the Conservative Party held the largest number of constituencies, with 36. The Liberal Democrats had 15 and Labour had 4. At the 2015 general election the Liberal Democrats lost all of their seats (14 to the Conservatives and one to Labour), while the Conservatives gained one seat from Labour, leaving the Conservatives with 51 and Labour with 4. In the 2017 general election, the Conservatives remained, by far, the largest party with 47 seats, though losing three to Labour, who won 7, and one to the Liberal Democrats, who won 1. In the 2019 general election,[2] the Conservatives increased their number of seats to 48 by regaining Stroud from Labour, who held their other six seats, while the Liberal Democrats retained their sole seat in Bath.
Constituencies
† Conservative ‡ Labour ¤ Liberal Democrat ♣ Green Party # Independent
Proposed boundary changes
See 2023 Periodic Review of Westminster constituencies for further details.
Following the abandonment of the Sixth Periodic Review (the 2018 review), the Boundary Commission for England formally launched the 2023 Review on 5 January 2021. The Commission calculated that the number of seats to be allocated to the South West region will increase by 3, from 55 to 58.[6] Initial proposals were published on 8 June 2021 and, following two periods of public consultation, revised proposals were published on 8 November 2022. The final proposals were published on 28 June 2023.
Under the proposals, the following constituencies for the region will come into effect at the next general election:[7]
| Constituency | Electorate | Ceremonial county | Local authority |
|---|---|---|---|
| Bath CC | 73,241 | Somerset | Bath and North East Somerset |
| Bournemouth East BC | 73,173 | Dorset | Bournemouth, Christchurch and Poole |
| Bournemouth West BC | 72,094 | Dorset | Bournemouth, Christchurch and Poole |
| Bridgwater CC | 71,418 | Somerset | Sedgemoor |
| Bristol Central BC | 70,227 | Bristol | Bristol |
| Bristol East BC | 75,936 | Bristol | Bristol |
| Bristol North East BC | 69,793 | Bristol / Gloucestershire | Bristol / South Gloucestershire |
| Bristol North West BC | 76,783 | Bristol | Bristol |
| Bristol South BC | 74,696 | Bristol | Bristol |
| Camborne and Redruth CC | 73,568 | Cornwall | Cornwall |
| Central Devon CC | 73,491 | Devon | Mid Devon / Teignbridge / West Devon |
| Cheltenham BC | 75,292 | Gloucestershire | Cheltenham |
| Chippenham CC | 71,648 | Wiltshire | Wiltshire |
| Christchurch CC | 71,598 | Dorset | Bournemouth, Christchurch and Poole / Dorset |
| East Wiltshire CC | 71,109 | Wiltshire | Swindon / Wiltshire |
| Exeter BC | 71,713 | Devon | Exeter |
| Exmouth and Exeter East CC | 74,502 | Devon | East Devon / Exeter |
| Filton and Bradley Stoke CC | 73,598 | Gloucestershire | South Gloucestershire |
| Forest of Dean CC | 71,510 | Gloucestershire | Forest of Dean / Tewkesbury |
| Frome and East Somerset CC | 70,177 | Somerset | Bath and North East Somerset / Mendip |
| Glastonbury and Somerton CC | 70,015 | Somerset | Mendip / South Somerset |
| Gloucester BC | 76,695 | Gloucestershire | Gloucester |
| Honiton and Sidmouth CC | 74,365 | Devon | East Devon / Mid Devon |
| Melksham and Devizes CC | 71,823 | Wiltshire | Wiltshire |
| Mid Dorset and North Poole CC | 74,305 | Dorset | Bournemouth, Christchurch and Poole / Dorset |
| Newton Abbot CC | 72,956 | Devon | Teignbridge |
| North Cornwall CC | 75,034 | Cornwall | Cornwall |
| North Cotswolds CC | 70,915 | Gloucestershire | Cotswold / Stroud / Tewkesbury |
| North Devon CC | 76,455 | Devon | North Devon |
| North Dorset CC | 72,109 | Dorset | Dorset |
| North East Somerset and Hanham CC | 73,113 | Gloucestershire / Somerset | Bath and North East Somerset / South Gloucestershire |
| North Somerset CC | 73,963 | Somerset | North Somerset |
| Plymouth Moor View BC | 73,378 | Devon | Plymouth |
| Plymouth Sutton and Devonport BC | 73,495 | Devon | Plymouth |
| Poole BC | 72,162 | Dorset | Bournemouth, Christchurch and Poole |
| Salisbury CC | 70,242 | Wiltshire | Wiltshire |
| South Cotswolds CC | 72,865 | Gloucestershire / Wiltshire | Cotswold / Stroud / Wiltshire |
| South Devon CC | 71,691 | Devon | South Hams / Torbay |
| South Dorset CC | 76,640 | Dorset | Dorset |
| South East Cornwall CC | 71,734 | Cornwall | Cornwall |
| South West Devon CC | 75,371 | Devon | Plymouth / South Hams / West Devon |
| South West Wiltshire CC | 71,551 | Wiltshire | Wiltshire |
| St Austell and Newquay CC | 74,585 | Cornwall | Cornwall |
| St Ives CC | 70,107 | Cornwall | Cornwall / Isles of Scilly |
| Stroud CC | 76,249 | Gloucestershire | Stroud |
| Swindon North CC | 72,163 | Wiltshire | Swindon |
| Swindon South BC | 72,468 | Wiltshire | Swindon |
| Taunton and Wellington CC | 76,049 | Somerset | Somerset West and Taunton |
| Tewkesbury CC | 72,426 | Gloucestershire | Cheltenham / Gloucester / Tewkesbury |
| Thornbury and Yate CC | 74,985 | Gloucestershire | South Gloucestershire |
| Tiverton and Minehead CC | 70,829 | Devon / Somerset | Mid Devon / Somerset West and Taunton |
| Torbay BC | 75,742 | Devon | Torbay |
| Torridge and Tavistock CC | 74,802 | Devon | Torridge / West Devon |
| Truro and Falmouth CC | 73,326 | Cornwall | Cornwall |
| Wells and Mendip Hills CC | 69,843 | Somerset | Mendip / North Somerset / Sedgemoor |
| West Dorset CC | 75,390 | Dorset | Dorset |
| Weston-super-Mare CC | 70,722 | Somerset | North Somerset |
| Yeovil CC | 76,056 | Somerset | South Somerset |
Results history
Primary data source: House of Commons research briefing - General election results from 1918 to 2019[8]
2019
The number of votes cast for each political party who fielded candidates in constituencies comprising the South West region in the 2019 general election were as follows:
| Party | Votes | % | Change from 2017 | Seats | Change from 2017 |
|---|---|---|---|---|---|
| Conservative | 1,612,090 | 52.8% | 48 | ||
| Labour | 713,226 | 23.3% | 6 | ||
| Liberal Democrats | 554,500 | 18.2% | 1 | 0 | |
| Greens | 115,011 | 3.8% | 0 | 0 | |
| Brexit | 11,139 | 0.4% | new | 0 | 0 |
| Others | 47,411 | 1.5% | 0 | 0 | |
| Total | 3,053,377 | 100.0 | 55 |
Percentage votes
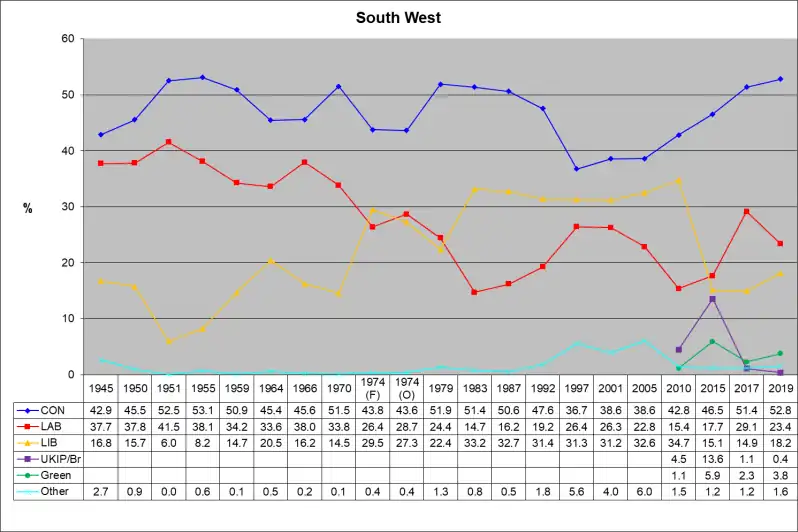
Key:
CON - Conservative Party, including National Liberal Party up to 1966
LAB - Labour Party
LIB - Liberal Party up to 1979; SDP-Liberal Alliance 1983 & 1987; Liberal Democrats from 1992
UKIP/Br - UK Independence Party 2010 to 2017 (included in Other up to 2005 and in 2019); Brexit Party in 2019
Green - Green Party of England and Wales (included in Other up to 2005)
Seats

Key:
CON - Conservative Party, including National Liberal Party up to 1966
LAB - Labour Party
LIB - Liberal Party up to 1979; SDP-Liberal Alliance 1983 & 1987; Liberal Democrats from 1992
OTH - 1945 - (1) Independent Progressive (Vernon Bartlett); (2) Independent National (Daniel Lipson)
Former constituencies
Abolished in 2010
- Bridgwater → Bridgwater and West Somerset
- Falmouth and Camborne → Camborne and Redruth, Truro and Falmouth
- Northavon → Thornbury and Yate, Filton and Bradley Stoke
- Plymouth Devonport → Plymouth Sutton and Devonport, Plymouth Moor View
- Plymouth Sutton → Plymouth Sutton and Devonport, Plymouth Moor View
- Taunton → Taunton Deane
- Teignbridge → Newton Abbot, Central Devon
- Truro and St Austell → Truro and Falmouth, St Austell and Newquay
- Wansdyke → North East Somerset
- Westbury → South West Wiltshire, Chippenham
- Woodspring → North Somerset
Abolished in 1997
See also
- List of United Kingdom Parliament constituencies
- List of parliamentary constituencies in Avon
- List of parliamentary constituencies in Cornwall
- List of parliamentary constituencies in Devon
- List of parliamentary constituencies in Dorset
- List of parliamentary constituencies in Gloucestershire
- List of parliamentary constituencies in Somerset
- List of parliamentary constituencies in Wiltshire
Notes
References
- ↑ See NUTS 1 statistical regions of England
- ↑ "Results of the 2019 General Election". BBC News. Retrieved 26 April 2020.
- ↑ Baker, Carl; Uberoi, Elise; Cracknell, Richard (28 January 2020). "General Election 2019: full results and analysis".
- 1 2 3 "Constituencies A-Z - Election 2019". BBC News. Retrieved 26 April 2020.
- 1 2 "The results". Mid Devon District Council. 23 June 2022. Retrieved 28 June 2022.
- ↑ "2023 Review". Boundary Commission for England. Retrieved 8 January 2021.
- ↑ "The 2023 Review of Parliamentary Constituency Boundaries in England – Volume two: Constituency names, designations and composition – South West". Boundary Commission for England. Retrieved 10 July 2023.
- ↑ Watson, Christopher; Uberoi, Elise; Loft, Philip (17 April 2020). "General election results from 1918 to 2019".
