51°36′14″N 2°31′05″W / 51.604°N 2.518°W
| Northavon | |
|---|---|
| Former County constituency for the House of Commons | |
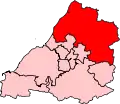
 Boundary of Northavon in Avon for the 2005 general election | |
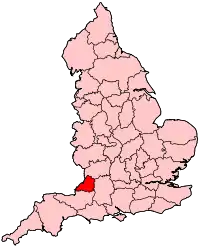
 Location of Avon within England | |
| County | 1983–1996 Avon 1996–2010 South Gloucestershire |
| Major settlements | Thornbury, Yate, Chipping Sodbury |
| 1983–2010 | |
| Seats | One |
| Created from | South Gloucestershire[1] |
| Replaced by | Thornbury and Yate, Filton and Bradley Stoke |
Northavon was, from 1983 until 2010, a constituency represented in the House of Commons of the Parliament of the United Kingdom. It elected one Member of Parliament (MP) by the first past the post system of election.
History
The constituency was established in 1983. Held initially by the Conservative Party, it was gained narrowly by the Liberal Democrats in 1997. The Almanac of British Politics described it as "one of the most unexpected Liberal Democrat gains" of the 1997 election and speculated that a significant amount of tactical voting had benefitted the party in this seat.[2] The seat then swung heavily in the Liberal Democrats favour in 2001 and was held again by the party in 2005.
Boundaries
1983–1997: The District of Northavon wards of Almondsbury, Alveston, Badminton, Charfield, Chipping Sodbury, Dodington North, Frampton Cotterell Central, Frampton Cotterell East, Frampton Cotterell West, Hawkesbury, Iron Acton, Marshfield, Oldbury-on-Severn, Olveston, Patchway Callicroft, Patchway Coniston, Patchway Stoke Lodge, Pilning and Severn Beach, Pucklechurch, Thornbury North, Thornbury South, Westerleigh Stanshawes, Westerleigh and Coalpit Heath, Wick and Abson, Wickwar, Winterbourne, Winterbourne Down and Hambrook, Winterbourne Frenchay, Yate Central, Yate North, Yate South, and Yate West.
1997–2010: The District of Northavon wards of Almondsbury, Alveston, Badminton, Charfield, Chipping Sodbury, Dodington North, Frampton Cotterell Central, Frampton Cotterell East, Frampton Cotterell West, Hawkesbury, Iron Acton, Marshfield, Oldbury-on-Severn, Olveston, Pilning and Severn Beach, Pucklechurch, Thornbury North, Thornbury South, Westerleigh and Coalpit Heath, Wick and Abson, Wickwar, Winterbourne, Winterbourne Down and Hambrook, Winterbourne Frenchay, Yate Central, Yate North, Yate South, Yate Stanshawes, and Yate West.
Northavon covered the same area as the former Northavon district (the more rural part of the current South Gloucestershire district) at its creation, but some of the constituency moved to Bristol North West with the boundary review implemented in 1997. The constituency included suburban and industrial areas on the outskirts of Bristol and several dormitory towns and small villages.
Following the review by the Boundary Commission for England of parliamentary representation in the former Avon county, taking effect at the 2010 general election, the Northavon seat has been abolished. It has been largely replaced by the Thornbury and Yate seat, but also by Filton and Bradley Stoke.[3]
Members of Parliament
| Election | Member[4] | Party | |
|---|---|---|---|
| 1983 | Sir John Cope | Conservative | |
| 1997 | Steve Webb | Liberal Democrat | |
| 2010 | constituency abolished: see Thornbury and Yate & Filton and Bradley Stoke | ||
Elections
Elections in the 2000s
| Party | Candidate | Votes | % | ±% | |
|---|---|---|---|---|---|
| Liberal Democrats | Steve Webb | 30,872 | 52.3 | -0.1 | |
| Conservative | Christopher Butt | 19,839 | 33.6 | −1.1 | |
| Labour | Patricia Gardener | 6,277 | 10.6 | −1.0 | |
| UKIP | Adrian Blake | 1,032 | 1.7 | +0.4 | |
| Green | Alan Pinder | 922 | 1.6 | New | |
| Independent | Thomas Beacham | 114 | 0.2 | New | |
| Majority | 11,033 | 18.7 | +1.0 | ||
| Turnout | 59,056 | 72.2 | +1.5 | ||
| Registered electors | 81,800 | +3.8 | |||
| Liberal Democrats hold | Swing | +0.5 | |||
| Party | Candidate | Votes | % | ±% | |
|---|---|---|---|---|---|
| Liberal Democrats | Steve Webb | 29,217 | 52.4 | +10.0 | |
| Conservative | Carrie Ruxton | 19,340 | 34.7 | −4.3 | |
| Labour | Robert Hall | 6,450 | 11.6 | −4.0 | |
| UKIP | Carmen Carver | 751 | 1.3 | -1.7 | |
| Majority | 9,877 | 17.7 | +14.3 | ||
| Turnout | 55,758 | 70.7 | −8.5 | ||
| Registered electors | 78,841 | -0.1 | |||
| Liberal Democrats hold | Swing | ||||
Elections in the 1990s
| Party | Candidate | Votes | % | ±% | |
|---|---|---|---|---|---|
| Liberal Democrats | Steve Webb | 26,500 | 42.4 | +7.9 | |
| Conservative | John Cope | 24,363 | 39.0 | -12.8 | |
| Labour | Ronald Stone | 9,767 | 15.6 | +3.5 | |
| UKIP | John Parfitt | 1,900 | 3.0 | New | |
| Majority | 2,137 | 3.4 | -13.9 | ||
| Turnout | 62,530 | 79.2 | -5.5 | ||
| Registered electors | 78,943 | +6.0 | |||
| Liberal Democrats gain from Conservative | Swing | +10.4 | |||
| Party | Candidate | Votes | % | ±% | |
|---|---|---|---|---|---|
| Conservative | John Cope | 35,338 | 50.3 | −4.1 | |
| Liberal Democrats | Heather Larkins | 23,477 | 33.4 | +1.7 | |
| Labour | Nita Norris | 10,290 | 14.6 | +0.7 | |
| Green | Jay Greene | 789 | 1.1 | 0.0 | |
| Liberal | Paul Marx | 380 | 0.5 | New | |
| Majority | 11,861 | 16.9 | −5.8 | ||
| Turnout | 70,274 | 84.2 | +4.0 | ||
| Registered electors | 83,496 | +6.4 | |||
| Conservative hold | Swing | −2.9 | |||
Elections in the 1980s
| Party | Candidate | Votes | % | ±% | |
|---|---|---|---|---|---|
| Conservative | John Cope | 34,244 | 54.4 | +0.7 | |
| Liberal | Christine Willmore | 19,954 | 31.7 | +0.6 | |
| Labour | Dan Norris | 8,762 | 13.9 | −0.5 | |
| Majority | 14,270 | 22.7 | +0.1 | ||
| Turnout | 62,960 | 80.2 | +2.2 | ||
| Registered electors | 78,483 | +6.7 | |||
| Conservative hold | Swing | 0.0 | |||
| Party | Candidate | Votes | % | ±% | |
|---|---|---|---|---|---|
| Conservative | John Cope | 30,790 | 53.7 | +0.9 | |
| Liberal | George Conrad | 17,807 | 31.1 | +12.6 | |
| Labour | Nita Norris | 8,243 | 14.4 | −13.4 | |
| Ecology | Keith Radmall | 499 | 0.9 | 0.0 | |
| Majority | 12,983 | 22.6 | −2.4 | ||
| Turnout | 57,339 | 78.0 | -7.4 | ||
| Registered electors | 73,553 | 0.0 | |||
| Conservative win (new seat) | |||||
See also
Notes and references
- ↑ "'Gloucestershire South', Feb 1974 – May 1983". ElectionWeb Project. Cognitive Computing Limited. Archived from the original on 3 April 2016. Retrieved 23 March 2016.
- ↑ Waller, Robert; Criddle, Byron (1999). The Almanac of British Politics (Sixth ed.). London: Routledge. pp. 587–588. ISBN 0-415-18541-6.
- ↑ "FINAL RECOMMENDATIONS FOR PARLIAMENTARY CONSTITUENCY BOUNDARIES IN THE UNITARY AUTHORITY OF SOUTH GLOUCESTERSHIRE". Boundary Commission for England. 15 November 2001. Archived from the original on 2 November 2009. Retrieved 24 April 2010.
- ↑ Leigh Rayment's Historical List of MPs – Constituencies beginning with "N" (part 3)
- ↑ "Politics Resources". Election 1997. Politics Resources. 1 May 1997. Archived from the original on 19 September 2011. Retrieved 7 January 2011.
- ↑ C. Rallings & M. Thrasher, The Media Guide to the New Parliamentary Constituencies, p.127 (Plymouth: LGC Elections Centre, 1995)
- ↑ The 1997 election result is calculated relative to the notional, not the actual, 1992 result.
- ↑ "Politics Resources". Election 1992. Politics Resources. 9 April 1992. Archived from the original on 24 July 2011. Retrieved 6 December 2010.
- ↑ Percentage change and swing for 1983 is calculated relative to the BBC/ITN 1979 notional constituency result, not actual 1979 result. See British Broadcasting Corporation; Independent Television News. The BBC/ITN Guide to the New Parliamentary Constituencies (Chichester: Parliamentary Research Services 1983)