Utica, Ohio | |
|---|---|
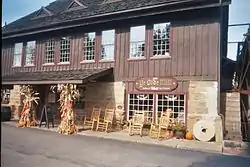
 Ye Olde Mill | |
| Motto: "What a great place to call home." | |
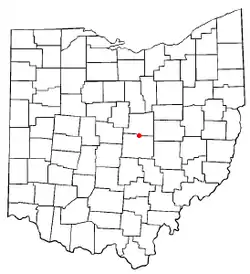
 Location of Utica, Ohio | |
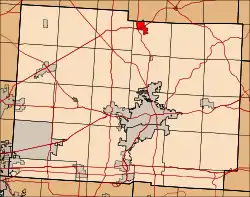
 Location in Licking County (highlighted) and Knox County | |
| Coordinates: 40°14′15″N 82°26′48″W / 40.23750°N 82.44667°W | |
| Country | United States |
| State | Ohio |
| Counties | Licking, Knox |
| Government | |
| • Mayor | Lester Grennel |
| Area | |
| • Total | 1.76 sq mi (4.55 km2) |
| • Land | 1.75 sq mi (4.52 km2) |
| • Water | 0.01 sq mi (0.03 km2) |
| Elevation | 958 ft (292 m) |
| Population (2020) | |
| • Total | 2,064 |
| • Density | 1,182.81/sq mi (456.58/km2) |
| Time zone | UTC-5 (Eastern (EST)) |
| • Summer (DST) | UTC-4 (EDT) |
| ZIP code | 43080 |
| Area code | 740 |
| FIPS code | 39-79114[3] |
| GNIS feature ID | 1065417[2] |
| Website | Village website |
Utica is a village in Knox and Licking counties in the U.S. state of Ohio, along the North Fork of the Licking River. The population was 2,064 at the 2020 census.
History
Utica was platted in 1815.[4] The village was named after Utica, New York.[5]
Utica was the largest hand blown window glass factory city in the US at the turn of the 20th century due to natural occurring silica and natural gas. The glass would be gathered in a molten ball and blown into a long tube. The ends would be cut off, the tube re-heated, cut, and laid flat creating the window glass. The glass companies closed with the 1929 crash and development of new glass.[6]
Prior to the Civil War, Utica was an important stop on the Underground Railroad. However, some local residents and a village historian claim that Utica was later a sundown town and recall Ku Klux Klan activity in the area in the 1920s.[7]
Geography
Utica is located at 40°14′15″N 82°26′48″W / 40.23750°N 82.44667°W (40.237493, -82.446797).[8]
According to the United States Census Bureau, the village has a total area of 1.71 square miles (4.43 km2), of which 1.69 square miles (4.38 km2) is land and 0.02 square miles (0.05 km2) is water.[9]
Demographics
| Census | Pop. | Note | %± |
|---|---|---|---|
| 1830 | 194 | — | |
| 1840 | 355 | 83.0% | |
| 1870 | 384 | — | |
| 1880 | 702 | 82.8% | |
| 1890 | 763 | 8.7% | |
| 1900 | 826 | 8.3% | |
| 1910 | 1,729 | 109.3% | |
| 1920 | 1,658 | −4.1% | |
| 1930 | 1,394 | −15.9% | |
| 1940 | 1,376 | −1.3% | |
| 1950 | 1,510 | 9.7% | |
| 1960 | 1,854 | 22.8% | |
| 1970 | 1,977 | 6.6% | |
| 1980 | 2,238 | 13.2% | |
| 1990 | 1,997 | −10.8% | |
| 2000 | 2,130 | 6.7% | |
| 2010 | 2,132 | 0.1% | |
| 2020 | 2,064 | −3.2% | |
| U.S. Decennial Census[10] | |||
2010 census
As of the census[11] of 2010, there were 2,132 people, 841 households, and 564 families living in the village. The population density was 1,261.5 inhabitants per square mile (487.1/km2). There were 937 housing units at an average density of 554.4 per square mile (214.1/km2). The racial makeup of the village was 97.7% White, 0.5% African American, 0.1% Native American, 0.2% Asian, 0.1% Pacific Islander, 0.1% from other races, and 1.2% from two or more races. Hispanic or Latino of any race were 0.9% of the population.
There were 841 households, of which 34.6% had children under the age of 18 living with them, 46.1% were married couples living together, 15.1% had a female householder with no husband present, 5.8% had a male householder with no wife present, and 32.9% were non-families. 28.7% of all households were made up of individuals, and 14% had someone living alone who was 65 years of age or older. The average household size was 2.50 and the average family size was 3.04.
The median age in the village was 37.4 years. 27.1% of residents were under the age of 18; 7.5% were between the ages of 18 and 24; 24.4% were from 25 to 44; 25.3% were from 45 to 64; and 15.8% were 65 years of age or older. The gender makeup of the village was 46.6% male and 53.4% female.
2000 census
As of the census[3] of 2000, there were 2,130 people, 822 households, and 569 families living in the village. The population density was 1,254.9 inhabitants per square mile (484.5/km2). There were 888 housing units at an average density of 523.2 per square mile (202.0/km2). The racial makeup of the village is 98.59% White, 0.09% African American, 0.09% Native American, 0.14% Asian, 0.00% Pacific Islander, 0.47% from other races, and 0.61% from two or more races. 0.94% of the population are Hispanic or Latino of any race.
There were 822 households, out of which 35.6% had children under the age of 18 living with them, 52.8% were married couples living together, 12.9% had a female householder with no husband present, and 30.7% were non-families. 27.6% of all households were made up of individuals, and 12.0% had someone living alone who was 65 years of age or older. The average household size was 2.51 and the average family size was 3.05.
In the village, the population was spread out, with 26.8% under the age of 18, 7.9% from 18 to 24, 29.1% from 25 to 44, 20.7% from 45 to 64, and 15.5% who were 65 years of age or older. The median age was 36 years. For every 100 females there were 95.8 males. For every 100 females age 18 and over, there were 88.9 males.
The median income for a household in the village was $34,238, and the median income for a family was $40,750. Males had a median income of $31,281 versus $23,243 for females. The per capita income for the village was $16,811. About 4.7% of families and 6.2% of the population were below the poverty line, including 7.0% of those under age 18 and 5.1% of those age 65 or over.
Education
North Fork Local Schools operates two elementary schools, one middle school, and Utica High School.[12]
Utica has a public library, a branch of the Licking County Library System.[13]
Public Safety
Law Enforcement: Utica Police Department
Fire & EMS: County Line Joint Fire District
Notable people
- Patt Morrison, author
- Todd Londot, professional football player, New York Giants
References
- ↑ "ArcGIS REST Services Directory". United States Census Bureau. Retrieved September 20, 2022.
- 1 2 U.S. Geological Survey Geographic Names Information System: Utica, Ohio
- 1 2 "U.S. Census website". United States Census Bureau. Retrieved January 31, 2008.
- ↑ Overman, William Daniel (1958). Ohio Town Names. Akron, OH: Atlantic Press. p. 136.
- ↑ Mangus, Michael; Herman, Jennifer L. (2008). Ohio Encyclopedia. North American Book Dist LLC. p. 561. ISBN 978-1-878592-68-2.
- ↑ Harp, Clint (2021). "Restoration Road, Ohio Grist Mill". Magnolia Network.
- ↑ Schuler, Jack (March 27, 2017). "'Sundown towns': Midwest confronts its complicated racial legacy". The Christian Science Monitor. Boston. Retrieved April 22, 2021.
- ↑ "US Gazetteer files: 2010, 2000, and 1990". United States Census Bureau. February 12, 2011. Retrieved April 23, 2011.
- ↑ "US Gazetteer files 2010". United States Census Bureau. Archived from the original on January 25, 2012. Retrieved January 6, 2013.
- ↑ "Census of Population and Housing". Census.gov. Retrieved June 4, 2015.
- ↑ "U.S. Census website". United States Census Bureau. Retrieved January 6, 2013.
- ↑ "Our schools". North Fork Local Schools. Retrieved February 26, 2018.
- ↑ "Hours & Locations". Licking County Library System. Retrieved February 26, 2018.

