Sabaragamuwa Province
සබරගමුව පළාත சப்ரகமுவ மாகாணம் | |
|---|---|
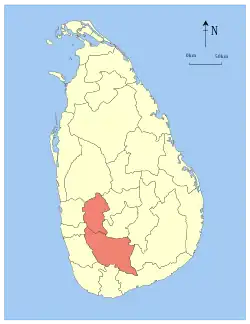
 Location within Sri Lanka | |
| Coordinates: 6°40′N 80°24′E / 6.667°N 80.400°E | |
| Country | Sri Lanka |
| Created | 1889 |
| Admitted | 14 November 1987 |
| Capital | Ratnapura |
| Largest city | Ratnapura |
| Districts | |
| Government | |
| • Type | Provincial council |
| • Body | Sabaragamuwa Provincial Council |
| • Governor | Navin Dissanayake |
| Area | |
| • Total | 4,968 km2 (1,918 sq mi) |
| • Rank | 8th (7.46% of total area) |
| Population (2011 census) | |
| • Total | 1,918,880 |
| • Rank | 5th (9.63% of total pop.) |
| • Density | 390/km2 (1,000/sq mi) |
| Ethnicity (2012 census)[1] | |
| • Sinhalese | 1,666,180 (86.4%) |
| • Indian Tamil | 105,872 (5.49%) |
| • Sri Lankan Moors | 82,343 (4.27%) |
| • Sri Lankan Tamil | 72,298 (3.75%) |
| • Other | 1,962 (0.09%) |
| Religion (2012 census)[2] | |
| • Buddhist | 1,653,381 (85.73%) |
| • Hindu | 156,312 (8.1%) |
| • Muslim | 85,610 (4.44%) |
| • Christian | 33,219 (1.72%) |
| • Other/None | 133 (0.006%) |
| Time zone | UTC+05:30 (Sri Lanka) |
| ISO 3166 code | LK-9 |
| Vehicle registration | SG |
| Official Languages | Sinhala, Tamil |
| Flower | Vesak flower (Dendrobium Maccarthiae) |
| Literacy (2012) | 94.8% |
| Computer literacy (2020) | 32% |
| Website | www |
The Sabaragamuwa Province (Sinhala: සබරගමුව පළාත Sabaragamuwa Paḷāta, Tamil: சபரகமுவ மாகாணம் Sabaragamuwa Mākāṇam) is one of the nine provinces of Sri Lanka. The city of Ratnapura is the capital of the province.
History
The provinces of Sri Lanka were created by the British in the 19th century, but did not have any legal status until 1987 when the 13th Amendment to the Constitution of Sri Lanka established provincial councils.[5][6]
The province is named after its former indigenous inhabitants, namely the Sabara, an Indic term for hunter-gatherer tribes, a term seldom used in ancient Sri Lanka.
The Sabaragamuwa University of Sri Lanka is located in the town of Belihuloya, and was founded in 1991.
Geography
The province has an area of 4,968 km2 and a population of 1,918,880. Major towns include Ratnapura and Kegalle.
Demographics
Ethnic groups
Ethnic groups in Sabaragamuwa province (2012 census)[7]
The Sinhalese are the majority ethnic group of the Sabaragamuwa province. Additionally, there are sizeable minority populations of Indian Tamils, Moors and Sri Lankan Tamils.
| Ethnic group | Population | % |
|---|---|---|
| Sinhalese | 1,666,180 | 86.4% |
| Indian Tamils | 105,872 | 5.49% |
| Sri Lankan Moors | 82,343 | 4.27% |
| Sri Lankan Tamils | 72,298 | 3.75% |
| Others | 1,962 | 0.09% |
| Total | 1,918,880 | 100.00% |
Religion
Religion in Sabaragamuwa province (2012 census)[8]
| Religion | Census 1981[11] | Census 2001[12] | Census 2012[13] | |||
|---|---|---|---|---|---|---|
| Population | % | Population | % | Population | % | |
| Buddhism | 1,259,396 | 84.98% | 1,547,769 | 85.77% | 1,653,381 | 85.73% |
| Hinduism | 146,010 | 9.86% | 148,400 | 8.2% | 156,312 | 8.1% |
| Islam | 51,248 | 3.46% | 73,576 | 4% | 85,610 | 4.44% |
| Christianity | 24,892 | 1.67% | 30,994 | 2% | 33,219 | 1.72% |
| Others/None | 485 | 0.03% | 592 | 0.03% | 133 | 0.006% |
| Total | 1,482,031 | 100% | 1,801,331 | 100% | 1,928,655 | 100% |
Administrative divisions
Sabaragamuwa is divided into two districts and 28 divisional secretariats.
Districts
| District | Capital | Area (km2) | Population |
|---|---|---|---|
| Kegalle District | Kegalle | 1,693 | 837,179 |
| Ratnapura District | Ratnapura | 3,275 | 1,088,007 |
Major population centres
- Ratnapura
- Balangoda
- Embilipitiya
- Kegalle
- Bulathkohupitiya
- Belihuloya
- Eheliyagoda
- Kalawana
- Kuruwita
- Mawanella
- Aranayaka
- Rakwana
- Imbulpe
- Deraniyagala
- Ambepussa
- Rambukkana
- Kitulgala
- Panamure
- Godakawela
- Yatiyanthota
- Karawanalla
- Ruwanwella
- Aguruwalla
- Dehiowita
See also
References
- ↑ "A2 : Population by ethnic group according to districts, 2012". Census of Population & Housing, 2011. Department of Census & Statistics, Sri Lanka.
- ↑ "A3 : Population by religion according to districts, 2012". Census of Population & Housing, 2011. Department of Census & Statistics, Sri Lanka.
- ↑ "Sri Lanka.pdf" (PDF). Department of Census & Statistics, Sri Lanka.
- ↑ "Computer Literacy Statistics-2020 (Annual)" (PDF). Department of Census and Statistics, Sri Lanka.
- ↑ "Provinces of Sri Lanka". Statoids.
- ↑ "Provincial Councils". Government of Sri Lanka. Archived from the original on 2009-07-07.
- ↑ "South Asia: Sri Lanka". CIA. 22 September 2021.
- ↑ "A3 : Population by religion according to districts, 2012". Census of Population & Housing, 2011. Department of Census & Statistics, Sri Lanka.
- ↑ "Population by religion and district, census 1981,2001,2012". Department of Census & Statistics, Sri Lanka.
- ↑ "Census of Population and Housing of Sri Lanka, 2012 - Table A4: Population by district, religion and sex" (PDF). Department of Census & Statistics, Sri Lanka. Archived (PDF) from the original on 2014-12-29.
- ↑ "Population by religion and district, census 1981,2001,2012". Department of Census & Statistics, Sri Lanka.
- ↑ "Population by religion and district, census 1981,2001,2012". Department of Census & Statistics, Sri Lanka.
- ↑ "Census of Population and Housing of Sri Lanka, 2012 - Table A4: Population by district, religion and sex" (PDF). Department of Census & Statistics, Sri Lanka. Archived (PDF) from the original on 2014-12-29.
.PNG.webp)


