Long Creek, Oregon | |
|---|---|
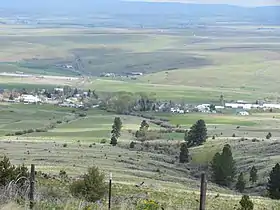
 Houses in Long Creek | |
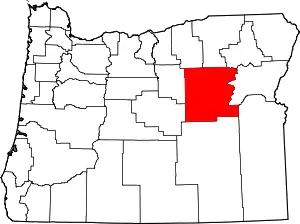
 Location in Oregon | |
| Coordinates: 44°42′51″N 119°06′15″W / 44.71417°N 119.10417°W | |
| Country | United States |
| State | Oregon |
| County | Grant |
| Incorporated | 1891 |
| Government | |
| • Mayor | Don Porter |
| Area | |
| • Total | 1.02 sq mi (2.65 km2) |
| • Land | 1.02 sq mi (2.65 km2) |
| • Water | 0.00 sq mi (0.00 km2) |
| Elevation | 3,744 ft (1,141 m) |
| Population | |
| • Total | 173 |
| • Density | 169.11/sq mi (65.32/km2) |
| Time zone | UTC-8 (Pacific) |
| • Summer (DST) | UTC-7 (Pacific) |
| ZIP code | 97856 |
| Area code | 541 |
| FIPS code | 41-43550[4] |
| GNIS feature ID | 2410868[2] |
Long Creek is a city in Grant County, Oregon, United States. The population was 173 at the 2020 census. The city is named after John Long, a prominent miner who came to Grant County in 1862 during the Canyon City rush of that same year. Located in a high valley of the Blue Mountains, ranching has been the principal enterprise for the area. Log harvesting was slowly curtailed in the nearby Malheur National Forest until the local mill was closed in 1998.
History
The city was incorporated in 1891. At the 1900 census the city recorded 123 residents.[5] Long Creek fell to 86 people in 1910, and then rebounded to 148 at 1920's census.[5] After dipping to 139 people in 1930, the city saw steady population growth for several decades with population numbers of 238 in 1940, 288 in 1950, and topping out at 295 residents in 1960.[5] By 1970 the city had fallen to 196 people, and then grew back to 252 people in 1980, before dropping to 249 citizens at the 1990 census.[5]
Geography
According to the United States Census Bureau, the city has a total area of 1.02 square miles (2.64 km2), all land.[6]
Climate
This region experiences warm (but not hot) and dry summers, with no average monthly temperatures above 71.6 °F. Despite its inland location, Long Creek has an oceanic climate (Csb) according to the Köppen climate classification system. Its cold winter temperatures nearly qualify its climate as a humid continental climate (Köppen Dfb).
| Climate data for Long Creek, Oregon (1991–2020 normals, extremes 1957–2021) | |||||||||||||
|---|---|---|---|---|---|---|---|---|---|---|---|---|---|
| Month | Jan | Feb | Mar | Apr | May | Jun | Jul | Aug | Sep | Oct | Nov | Dec | Year |
| Record high °F (°C) | 67 (19) |
69 (21) |
77 (25) |
88 (31) |
94 (34) |
101 (38) |
106 (41) |
108 (42) |
102 (39) |
88 (31) |
75 (24) |
65 (18) |
108 (42) |
| Mean daily maximum °F (°C) | 40.4 (4.7) |
44.0 (6.7) |
50.4 (10.2) |
56.3 (13.5) |
65.1 (18.4) |
72.6 (22.6) |
84.0 (28.9) |
84.7 (29.3) |
75.6 (24.2) |
61.5 (16.4) |
47.4 (8.6) |
39.3 (4.1) |
60.1 (15.6) |
| Daily mean °F (°C) | 31.4 (−0.3) |
33.7 (0.9) |
38.8 (3.8) |
43.6 (6.4) |
51.1 (10.6) |
57.1 (13.9) |
65.3 (18.5) |
65.4 (18.6) |
57.9 (14.4) |
47.3 (8.5) |
37.3 (2.9) |
30.4 (−0.9) |
46.6 (8.1) |
| Mean daily minimum °F (°C) | 22.3 (−5.4) |
23.5 (−4.7) |
27.3 (−2.6) |
30.9 (−0.6) |
37.1 (2.8) |
41.5 (5.3) |
46.7 (8.2) |
46.1 (7.8) |
40.1 (4.5) |
33.0 (0.6) |
27.2 (−2.7) |
21.6 (−5.8) |
33.1 (0.6) |
| Record low °F (°C) | −23 (−31) |
−21 (−29) |
2 (−17) |
9 (−13) |
17 (−8) |
22 (−6) |
28 (−2) |
26 (−3) |
17 (−8) |
−1 (−18) |
−10 (−23) |
−25 (−32) |
−25 (−32) |
| Average precipitation inches (mm) | 1.60 (41) |
1.35 (34) |
1.70 (43) |
1.76 (45) |
2.34 (59) |
1.48 (38) |
0.62 (16) |
0.57 (14) |
0.66 (17) |
1.60 (41) |
1.65 (42) |
1.83 (46) |
17.16 (436) |
| Average snowfall inches (cm) | 7.2 (18) |
5.6 (14) |
5.8 (15) |
2.3 (5.8) |
0.1 (0.25) |
0.0 (0.0) |
0.0 (0.0) |
0.0 (0.0) |
0.0 (0.0) |
0.3 (0.76) |
3.6 (9.1) |
8.2 (21) |
33.1 (84) |
| Average precipitation days (≥ 0.01 in) | 12.5 | 11.2 | 13.3 | 13.5 | 11.8 | 8.0 | 3.2 | 3.0 | 4.1 | 9.2 | 11.4 | 12.2 | 113.4 |
| Average snowy days (≥ 0.1 in) | 4.6 | 4.2 | 4.0 | 2.0 | 0.1 | 0.1 | 0.0 | 0.0 | 0.0 | 0.4 | 2.8 | 5.3 | 23.5 |
| Source: NOAA[7][8] | |||||||||||||
Demographics
| Census | Pop. | Note | %± |
|---|---|---|---|
| 1890 | 60 | — | |
| 1900 | 123 | 105.0% | |
| 1910 | 86 | −30.1% | |
| 1920 | 148 | 72.1% | |
| 1930 | 139 | −6.1% | |
| 1940 | 238 | 71.2% | |
| 1950 | 288 | 21.0% | |
| 1960 | 295 | 2.4% | |
| 1970 | 196 | −33.6% | |
| 1980 | 252 | 28.6% | |
| 1990 | 249 | −1.2% | |
| 2000 | 228 | −8.4% | |
| 2010 | 197 | −13.6% | |
| 2020 | 173 | −12.2% | |
| U.S. Decennial Census[9][3] | |||
2010 census
As of the census of 2010, there were 197 people, 84 households, and 52 families residing in the city. The population density was 193.1 inhabitants per square mile (74.6/km2). There were 112 housing units at an average density of 109.8 per square mile (42.4/km2). The racial makeup of the city was 94.4% White, 1.5% Native American, 0.5% from other races, and 3.6% from two or more races. Hispanic or Latino of any race were 5.6% of the population.[4]
There were 84 households, of which 28.6% had children under the age of 18 living with them, 52.4% were married couples living together, 6.0% had a female householder with no husband present, 3.6% had a male householder with no wife present, and 38.1% were non-families. 33.3% of all households were made up of individuals, and 16.6% had someone living alone who was 65 years of age or older. The average household size was 2.35 and the average family size was 2.98.[4]
The median age in the city was 47.2 years. 20.8% of residents were under the age of 18; 10.3% were between the ages of 18 and 24; 16.8% were from 25 to 44; 34% were from 45 to 64; and 18.3% were 65 years of age or older. The gender makeup of the city was 48.2% male and 51.8% female.[4]
2000 census
As of the census of 2000, there were 228 people, 96 households, and 60 families residing in the city. The population density was 222.9 inhabitants per square mile (86.1/km2). There were 115 housing units at an average density of 112.4 per square mile (43.4/km2). The racial makeup of the city was 96.05% White, 0.88% Native American, and 3.07% from two or more races. Hispanic or Latino of any race were 0.44% of the population.[4]
There were 96 households, out of which 31.3% had children under the age of 18 living with them, 53.1% were married couples living together, 8.3% had a female householder with no husband present, and 36.5% were non-families. 30.2% of all households were made up of individuals, and 12.5% had someone living alone who was 65 years of age or older. The average household size was 2.38 and the average family size was 2.93.[4]
In the city, the population was spread out, with 27.2% under the age of 18, 3.9% from 18 to 24, 28.5% from 25 to 44, 24.1% from 45 to 64, and 16.2% who were 65 years of age or older. The median age was 39 years. For every 100 females, there were 96.6 males. For every 100 females age 18 and over, there were 102.4 males.[4]
The median income for a household in the city was $31,250, and the median income for a family was $33,393. Males had a median income of $29,583 versus $16,875 for females. The per capita income for the city was $16,076. About 17.5% of families and 17.2% of the population were below the poverty line, including 13.2% of those under the age of 18 and 20.5% of those 65 or over.[4]
References
- ↑ "ArcGIS REST Services Directory". United States Census Bureau. Retrieved October 12, 2022.
- 1 2 U.S. Geological Survey Geographic Names Information System: Long Creek, Oregon
- 1 2 "Census Population API". United States Census Bureau. Retrieved October 12, 2022.
- 1 2 3 4 5 6 7 8 "U.S. Census website". United States Census Bureau. Retrieved December 21, 2012.
- 1 2 3 4 Moffat, Riley Moore (1996). Population History of Western U.S. Cities and Towns, 1850-1990. Scarecrow Press. p. 212.
- ↑ "US Gazetteer files 2010". United States Census Bureau. Archived from the original on July 2, 2012. Retrieved December 21, 2012.
- ↑ "NOWData - NOAA Online Weather Data". National Oceanic and Atmospheric Administration. Retrieved December 10, 2023.
- ↑ "Summary of Monthly Normals 1991-2020". National Oceanic and Atmospheric Administration. Retrieved December 10, 2023.
- ↑ "Census of Population and Housing". Census.gov. Retrieved June 4, 2015.
External links
- "Long Creek (town)". The Oregon Encyclopedia.
- Entry for Long Creek in the Oregon Blue Book
- Grant County Chamber of Commerce entry for Long Creek
