Ligerz | |
|---|---|
 Ligerz | |
 Flag  Coat of arms | |
Location of Ligerz | |
 Ligerz  Ligerz | |
| Coordinates: 47°5′N 7°8′E / 47.083°N 7.133°E | |
| Country | Switzerland |
| Canton | Bern |
| District | Biel/Bienne |
| Government | |
| • Mayor | Uli Berger |
| Area | |
| • Total | 1.8 km2 (0.7 sq mi) |
| Elevation | 433 m (1,421 ft) |
| Population (31 December 2018)[2] | |
| • Total | 544 |
| • Density | 300/km2 (780/sq mi) |
| Time zone | UTC+01:00 (Central European Time) |
| • Summer (DST) | UTC+02:00 (Central European Summer Time) |
| Postal code(s) | 2514 |
| SFOS number | 0740 |
| Surrounded by | Lamboing, Twann, La Neuveville, Prêles |
| Twin towns | Erôme (France) |
| Website | www SFSO statistics |
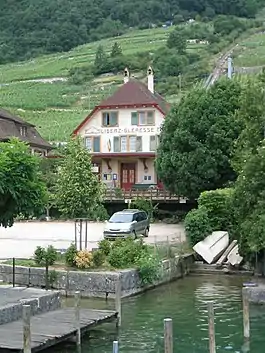
Ligerz (French: Gléresse) is a municipality in the Biel/Bienne administrative district in the canton of Bern in Switzerland.
History


Ligerz is first mentioned in 1236 as Ligerce.[3]
The shore of Lake Biel was inhabited during the neolithic period. A neolithic shoreline settlement has been discovered near the municipal border close to the village of Schafis, which is part of the La Neuveville municipality. Other traces of prehistoric settlements include scattered Bronze Age and Roman era artifacts. During the Middle Ages Ligerz was ruled by the Lords of Ligerz, who held it as a fief for the Counts of Nidau. Their castle, the Festi, first appeared in historical records in 1236. In 1358, the Herrschaft of Ligerz was divided between two lines of the ruling family. At the end of the 14th century, the lands were pledged to the city of Biel to secure a loan. Between 1388 and 1393, Bern acquired the sovereignty over the land of the Counts of Nidau including Ligerz village and the surrounding lands. However, Bern did not own either half of the land of Ligerz. The two halves were sold to the von Büren and von Muleren families, both Bernese patrician families. In 1409 one half of the Herrschaft was sold to the city of Biel, while the other half was sold in Bern in 1469. Finally in 1551, Biel sold the other half of Ligerz to Bern. In 1553 Bern reaffirmed the old market and fishing rights that the village had received from earlier rulers.[3]
The pilgrimage church of Ligerz was first mentioned in 1261. It was built in the vineyards above the village and was originally a filial church of the parish of Diesse. It became a parish church of its own parish in 1434, but was still dependent on Diesse until the Ligerz church was rebuilt in 1520-26. Between 1876 and 1889, it was part of the Twann parish.[3]
The slopes of the Jura Mountains above the village were covered with vineyards by the Middle Ages. The vineyards were owned by a variety of towns and monasteries including Biel, Bern, Erlach Abbey, Fraubrunnen Abbey and Thorberg Abbey. Over the following centuries, patricians from Bern and Biel bought the vineyards. During the 17th and 18th centuries these patrician families built elegant townhouses in the village, which they would visit during harvest. Until the 18th century the village had a French speaking majority and the village school was bilingual (French/German) until the end of that century. Today the official language in Ligerz is German.[3]
Following the 1798 French invasion, Ligerz became part of the District of Zealand. The 1803 Act of Mediation placed it in the Nidau district.[3]
Until the early 19th century there were no good roads into Ligerz, instead goods and travelers came by boat. In 1835-38 the Biel Road connected Ligerz and the other communities along the lake shore with the city of Biel. The Biel-Neuchâtel railroad, which was built in 1858-60, connected Ligerz to rest of the country. In 1911-12 the Ligerz-Tessenberg funicular was built, allowing travel into the mountains. Due to the limited flat land in Ligerz, a tunnel was built in 1984-91 to route the motorway near the municipality while preserving the appearance of the village. Today the major industries in Ligerz include wine making, tourism and fishing.[3]
Geography


Ligerz has an area of 1.79 km2 (0.69 sq mi).[4] As of 2012, a total of 0.57 km2 (0.22 sq mi) or 31.7% is used for agricultural purposes, while 0.91 km2 (0.35 sq mi) or 50.6% is forested. Of the rest of the land, 0.23 km2 (0.089 sq mi) or 12.8% is settled (buildings or roads), 0.04 km2 (9.9 acres) or 2.2% is either rivers or lakes and 0.03 km2 (7.4 acres) or 1.7% is unproductive land.[5]
During the same year, housing and buildings made up 8.9% and transportation infrastructure made up 3.3%. Out of the forested land, all of the forested land area is covered with heavy forests. Of the agricultural land, 2.2% is pastures, while 29.4% is used for orchards or vine crops. Of the water in the municipality, 1.1% is in lakes and 1.1% is in rivers and streams.[5]
The municipality is located in the Bernese Seeland at the north end of Lake Biel. It consists of the village of Ligerz and the hamlets of Bipschal and half of Kleintwann (shared with Twann) near the lake and the hamlets of Schernelz and Festi on a terrace in the Jura Mountains.
On 31 December 2009 Amtsbezirk Nidau, the municipality's former district, was dissolved. On the following day, 1 January 2010, it joined the newly created Verwaltungskreis Biel/Bienne.[6]
Coat of arms
The blazon of the municipal coat of arms is Azure a Latin Cross Argent issuant from a Mount of 3 Coupeaux Vert between two Vine Trees propped and the dexter fructed and the sinister leaved all Or and in sinister fess point a Sickle of the Second.[7]
Demographics

Ligerz has a population (as of December 2020) of 545.[8] As of 2010, 5.7% of the population are resident foreign nationals. Over the last 10 years (2001-2011) the population has changed at a rate of -1.3%. Migration accounted for 0%, while births and deaths accounted for -0.4%.[9]
Most of the population (as of 2000) speaks German (442 or 90.2%) as their first language, French is the second most common (31 or 6.3%) and English is the third (6 or 1.2%). There are 2 people who speak Italian.[10]
As of 2008, the population was 47.9% male and 52.1% female. The population was made up of 234 Swiss men (44.5% of the population) and 18 (3.4%) non-Swiss men. There were 262 Swiss women (49.8%) and 1 (0.2%) non-Swiss women.[11] Of the population in the municipality, 158 or about 32.2% were born in Ligerz and lived there in 2000. There were 162 or 33.1% who were born in the same canton, while 110 or 22.4% were born somewhere else in Switzerland, and 41 or 8.4% were born outside of Switzerland.[10]
As of 2011, children and teenagers (0–19 years old) make up 17% of the population, while adults (20–64 years old) make up 58.8% and seniors (over 64 years old) make up 24.3%.[9]
As of 2000, there were 171 people who were single and never married in the municipality. There were 266 married individuals, 28 widows or widowers and 25 individuals who are divorced.[10]
As of 2010, there were 89 households that consist of only one person and 10 households with five or more people.[12] In 2000, a total of 219 apartments (76.0% of the total) were permanently occupied, while 51 apartments (17.7%) were seasonally occupied and 18 apartments (6.3%) were empty.[13] The vacancy rate for the municipality, in 2012, was 0.63%. In 2011, single family homes made up 58.6% of the total housing in the municipality.[14]
The historical population is given in the following chart:[3][15]

Heritage sites of national significance
The Aarberger House at Hauptstrasse 19, the Gaberel House Nr. 53 at Dorfgasse 20 and the village church are listed as Swiss heritage site of national significance. The entire village of Ligerz and the hamlet of Bipschal are both part of the Inventory of Swiss Heritage Sites.[16]
 Aarberger House
 Gaberel House Nr. 53
 Church
Politics
In the 2011 federal election the most popular party was the Conservative Democratic Party (BDP) which received 23.2% of the vote. The next three most popular parties were the Swiss People's Party (SVP) (20.8%), the Social Democratic Party (SP) (17.6%) and the FDP.The Liberals (12.1%). In the federal election, a total of 267 votes were cast, and the voter turnout was 62.4%.[17]
Economy
As of 2011, Ligerz had an unemployment rate of 1%. As of 2008, there were a total of 192 people employed in the municipality. Of these, there were 103 people employed in the primary economic sector and about 29 businesses involved in this sector. 22 people were employed in the secondary sector and there were 5 businesses in this sector. 67 people were employed in the tertiary sector, with 15 businesses in this sector.[9] There were 263 residents of the municipality who were employed in some capacity, of which females made up 46.0% of the workforce.
In 2008 there were a total of 123 full-time equivalent jobs. The number of jobs in the primary sector was 56, of which 51 were in agriculture and 4 were in fishing or fisheries. The number of jobs in the secondary sector was 21 of which 5 or (23.8%) were in manufacturing and 16 (76.2%) were in construction. The number of jobs in the tertiary sector was 46. In the tertiary sector; 3 or 6.5% were in wholesale or retail sales or the repair of motor vehicles, 4 or 8.7% were in the movement and storage of goods, 23 or 50.0% were in a hotel or restaurant, 1 was in the information industry, 3 or 6.5% were technical professionals or scientists, 1 was in education.[18]
In 2000, there were 37 workers who commuted into the municipality and 175 workers who commuted away. The municipality is a net exporter of workers, with about 4.7 workers leaving the municipality for every one entering. A total of 88 workers (70.4% of the 125 total workers in the municipality) both lived and worked in Ligerz.[19] Of the working population, 15.6% used public transportation to get to work, and 54.4% used a private car.[9]
In 2011 the average local and cantonal tax rate on a married resident, with two children, of Ligerz making 150,000 CHF was 12%, while an unmarried resident's rate was 17.6%.[20] For comparison, the rate for the entire canton in the same year, was 14.2% and 22.0%, while the nationwide rate was 12.3% and 21.1% respectively.[21] In 2009 there were a total of 254 tax payers in the municipality. Of that total, 106 made over 75,000 CHF per year. There were 4 people who made between 15,000 and 20,000 per year. The average income of the over 75,000 CHF group in Ligerz was 146,245 CHF, while the average across all of Switzerland was 130,478 CHF.[22]
Religion

From the 2000 census, 356 or 72.7% belonged to the Swiss Reformed Church, while 55 or 11.2% were Roman Catholic. Of the rest of the population, there were 3 individuals (or about 0.61% of the population) who belonged to another Christian church. There were 6 (or about 1.22% of the population) who were Islamic. There were 1 individual who belonged to another church. 59 (or about 12.04% of the population) belonged to no church, are agnostic or atheist, and 10 individuals (or about 2.04% of the population) did not answer the question.[10]
Education
In Ligerz about 55.7% of the population have completed non-mandatory upper secondary education, and 34.4% have completed additional higher education (either university or a Fachhochschule).[9] Of the 115 who had completed some form of tertiary schooling listed in the census, 61.7% were Swiss men, 29.6% were Swiss women, 6.1% were non-Swiss men.[10]
As of 2000, there were a total of 9 students attending any school in the municipality. Of those, 8 both lived and attended school in the municipality, while one student came from another municipality. During the same year, 61 residents attended schools outside the municipality.[19]
Transportation

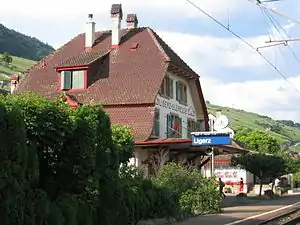
The town has a train station. There is a harbor for the Bielersee Schiffahrt Gesellschaft AG (Lake Biel ship travel company). There is also Vinifuni Ligerz–Prêles, a funicular to Prêles.
References
- ↑ "Arealstatistik Standard - Gemeinden nach 4 Hauptbereichen". Federal Statistical Office. Retrieved 13 January 2019.
- ↑ "Ständige Wohnbevölkerung nach Staatsangehörigkeitskategorie Geschlecht und Gemeinde; Provisorische Jahresergebnisse; 2018". Federal Statistical Office. 9 April 2019. Retrieved 11 April 2019.
- 1 2 3 4 5 6 7 Ligerz in German, French and Italian in the online Historical Dictionary of Switzerland.
- ↑ Arealstatistik Standard - Gemeindedaten nach 4 Hauptbereichen
- 1 2 Swiss Federal Statistical Office-Land Use Statistics 2009 data (in German) accessed 25 March 2010
- ↑ Nomenklaturen – Amtliches Gemeindeverzeichnis der Schweiz (in German) accessed 4 April 2011
- ↑ Flags of the World.com accessed 9 August 2013
- ↑ "Ständige und nichtständige Wohnbevölkerung nach institutionellen Gliederungen, Geburtsort und Staatsangehörigkeit". bfs.admin.ch (in German). Swiss Federal Statistical Office - STAT-TAB. 31 December 2020. Retrieved 21 September 2021.
- 1 2 3 4 5 Swiss Federal Statistical Office Archived 2016-01-05 at the Wayback Machine accessed 9 August 2013
- 1 2 3 4 5 STAT-TAB Datenwürfel für Thema 40.3 - 2000 Archived 2014-04-09 at the Wayback Machine (in German) accessed 2 February 2011
- ↑ Statistical office of the Canton of Bern (in German) accessed 4 January 2012
- ↑ Swiss Federal Statistical Office - Haushaltsgrösse Archived 2014-10-06 at the Wayback Machine (in German) accessed 8 May 2013
- ↑ Swiss Federal Statistical Office STAT-TAB - Datenwürfel für Thema 09.2 - Gebäude und Wohnungen Archived 2014-09-07 at the Wayback Machine (in German) accessed 28 January 2011
- ↑ Statistischer Atlas der Schweiz - Anteil Einfamilienhäuser am gesamten Gebäudebestand, 2011 accessed 17 June 2013
- ↑ Swiss Federal Statistical Office STAT-TAB Bevölkerungsentwicklung nach Region, 1850-2000 Archived 2014-09-30 at the Wayback Machine (in German) accessed 29 January 2011
- ↑ "Kantonsliste A-Objekte". KGS Inventar (in German). Federal Office of Civil Protection. 2009. Archived from the original on 28 June 2010. Retrieved 25 April 2011.
- ↑ Swiss Federal Statistical Office 2011 Election Archived 2013-11-14 at the Wayback Machine (in German) accessed 8 May 2012
- ↑ Swiss Federal Statistical Office STAT-TAB Betriebszählung: Arbeitsstätten nach Gemeinde und NOGA 2008 (Abschnitte), Sektoren 1-3 Archived 2014-12-25 at the Wayback Machine (in German) accessed 28 January 2011
- 1 2 Swiss Federal Statistical Office - Statweb Archived 2012-08-04 at archive.today (in German) accessed 24 June 2010
- ↑ Statistischer Atlas der Schweiz - Steuerbelastung, 2011 Politische Gemeinden (in German) accessed 15 May 2013
- ↑ Swiss Federal Tax Administration - Grafische Darstellung der Steuerbelastung 2011 in den Kantonen (in German and French) accessed 17 June 2013
- ↑ Federal Tax Administration Report Direkte Bundessteuer - Natürliche Personen - Gemeinden - Steuerjahr 2009 Archived 2014-10-06 at the Wayback Machine (in German and French) accessed 15 May 2013
External links
- Ligerz in German, French and Italian in the online Historical Dictionary of Switzerland.