| |||||||||||||||||||||||||||||||
All 118 seats in the Illinois House of Representatives 60 seats needed for a majority | |||||||||||||||||||||||||||||||
|---|---|---|---|---|---|---|---|---|---|---|---|---|---|---|---|---|---|---|---|---|---|---|---|---|---|---|---|---|---|---|---|
| |||||||||||||||||||||||||||||||


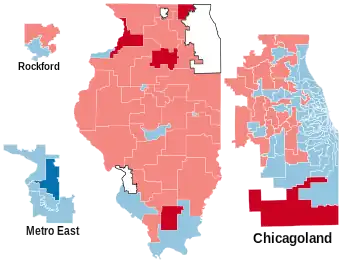
Results: Democratic gain Republican gain Democratic hold Republican hold Vote Share: 50–60% 60–70% 70–80% 80–90% >90% 50–60% 60–70% 70–80% >90% | |||||||||||||||||||||||||||||||
| |||||||||||||||||||||||||||||||
| Elections in Illinois |
|---|
 |
The 2016 Elections for the Illinois House of Representatives were conducted on Tuesday, November 8, 2016. State Representatives are elected for two-year terms, with the entire House of Representatives elected every two years. The Democratic party lost a net of four seats and thus its three-fifths supermajority in the chamber. Republicans picked up five seats in the 63rd (McHenry County), 71st (Sterling), 76th (LaSalle), 79th (Kankakee), and 117th (Marion) districts, whilst the Democrats won the previously Republican held 112th district (Edwardsville/Collinsville)
Overview
| Illinois State House Elections, 2016 | ||||||||
|---|---|---|---|---|---|---|---|---|
| Party | Votes | Percentage | % Change | Seats before |
Seats after |
+/– | ||
| Democratic | 2,604,236 | 53.87% | 71 | 67 | ||||
| Republican | 2,222,482 | 45.97% | 47 | 51 | ||||
| Totals | 4,834,247 | 100.00% | — | 118 | 118 | — | ||
Results
Source: Illinois State Board of Elections,[1] Ballotpedia[2][3]
References
- ↑ "Election Results". Illinois State Board of Elections. Archived from the original on December 20, 2016. Retrieved December 17, 2016.
- ↑ "Illinois State Senate elections, 2016 - Ballotpedia". Retrieved December 17, 2016.
- ↑ "Illinois House of Representatives elections, 2016 - Ballotpedia". Retrieved December 17, 2016.
External links
This article is issued from Wikipedia. The text is licensed under Creative Commons - Attribution - Sharealike. Additional terms may apply for the media files.
