| Dunfermline West | |
|---|---|
| Former County constituency for the House of Commons | |
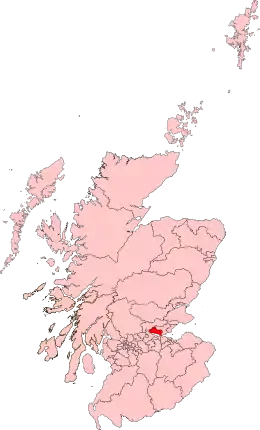
 Boundary of Dunfermline West in Scotland for the 2001 general election | |
| Major settlements | Dunfermline |
| 1983–2005 | |
| Seats | One |
| Created from | Dunfermline |
| Replaced by | Dunfermline & West Fife |
Dunfermline West was a county constituency represented in the House of Commons of the Parliament of the United Kingdom from 1983 until 2005. It elected one Member of Parliament (MP) using the first-past-the-post voting system.
Before 1983 the area was covered by the Dunfermline constituency and from 2005 the seat was replaced by the new Dunfermline and West Fife.
Boundaries
The seat of Dunfermline West contained all of the town of Dunfermline as well as territory on the north bank of the Firth of Forth. It took in the affluent villages of Limekilns, Crossford and Cairneyhill; it also included coalfield communities such as High Valleyfield, Saline, Blairhall and Oakley.
Members of Parliament
| Election | Member[1] | Party | |
|---|---|---|---|
| 1983 | Dick Douglas | Labour Co-operative | |
| 1990 | Independent | ||
| 1990 | SNP | ||
| 1992 | Rachel Squire | Labour | |
| 2005 | constituency abolished | ||
Elections
Elections in the 1980s
| Party | Candidate | Votes | % | ±% | |
|---|---|---|---|---|---|
| Labour Co-op | Dick Douglas | 12,998 | 36.0 | -8.8 | |
| Conservative | Peter Davidson | 10,524 | 29.2 | +0.6 | |
| SDP | Frank Moyes | 9,434 | 26.1 | +14.5 | |
| SNP | Jim Fairlie | 2,798 | 7.8 | -7.2 | |
| Ecology | Stuart Dobson | 321 | 0.9 | New | |
| Majority | 2,474 | 6.8 | -9.4 | ||
| Turnout | 49,075 | 73.5 | |||
| Labour win (new seat) | |||||
| Party | Candidate | Votes | % | ±% | |
|---|---|---|---|---|---|
| Labour Co-op | Dick Douglas | 18,493 | 47.1 | +11.1 | |
| Conservative | Phil Gallie | 9,091 | 23.1 | −6.1 | |
| SDP | Frank Moyes | 8,288 | 21.1 | −5.0 | |
| SNP | Gordon Hughes | 3,435 | 8.7 | +0.9 | |
| Majority | 9,402 | 24.0 | +17.2 | ||
| Turnout | 39,307 | 76.9 | +3.4 | ||
| Labour hold | Swing | ||||
Elections in the 1990s
| Party | Candidate | Votes | % | ±% | |
|---|---|---|---|---|---|
| Labour | Rachel Squire | 16,374 | 42.0 | −5.1 | |
| Conservative | Michael D.A. Scott-Hayward | 8,890 | 22.8 | −0.3 | |
| SNP | Jay Smith | 7,563 | 19.4 | +10.7 | |
| Liberal Democrats | Elizabeth Harris | 6,122 | 15.7 | −5.4 | |
| Majority | 7,484 | 19.2 | -4.8 | ||
| Turnout | 38,949 | 76.4 | −0.5 | ||
| Labour hold | Swing | ||||
| Party | Candidate | Votes | % | ±% | |
|---|---|---|---|---|---|
| Labour | Rachel Squire | 19,338 | 53.1 | +11.6 | |
| SNP | John Lloyd | 6,984 | 19.2 | −0.7 | |
| Liberal Democrats | Elizabeth Harris | 4,963 | 13.6 | −2.0 | |
| Conservative | Kevin Newton | 4,606 | 12.6 | −10.4 | |
| Referendum | James Bain | 543 | 1.5 | New | |
| Majority | 12,354 | 33.9 | +20.7 | ||
| Turnout | 36,434 | 69.3 | −7.1 | ||
| Labour hold | Swing | ||||
Elections in the 2000s
| Party | Candidate | Votes | % | ±% | |
|---|---|---|---|---|---|
| Labour | Rachel Squire | 16,370 | 52.8 | −0.3 | |
| SNP | Brian Goodall | 5,390 | 17.4 | −1.8 | |
| Liberal Democrats | Russel McPhate | 4,832 | 15.6 | +2.0 | |
| Conservative | James Mackie | 3,166 | 10.2 | −2.4 | |
| Scottish Socialist | Catherine Stewart | 746 | 2.4 | New | |
| UKIP | Alastair Harper | 471 | 1.5 | New | |
| Majority | 10,980 | 35.4 | +1.5 | ||
| Turnout | 30,975 | 57.1 | −12.2 | ||
| Labour hold | Swing | 0.8 SNP to Labour | |||
References
- ↑ Leigh Rayment's Historical List of MPs – Constituencies beginning with "D" (part 4)
- ↑ "Election Data 1983". Electoral Calculus. Archived from the original on 15 October 2011. Retrieved 18 October 2015.
- ↑ "Election Data 1987". Electoral Calculus. Archived from the original on 15 October 2011. Retrieved 18 October 2015.
- ↑ "Election Data 1992". Electoral Calculus. Archived from the original on 15 October 2011. Retrieved 18 October 2015.
- ↑ "Election Data 1997". Electoral Calculus. Archived from the original on 15 October 2011. Retrieved 18 October 2015.
- ↑ "Election Data 2001". Electoral Calculus. Archived from the original on 15 October 2011. Retrieved 18 October 2015.
This article is issued from Wikipedia. The text is licensed under Creative Commons - Attribution - Sharealike. Additional terms may apply for the media files.