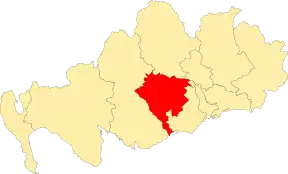
Location of the ward [1]
Castle Douglas and Crocketford is one of the thirteen wards used to elect members of the Dumfries and Galloway Council. It elects three Councillors.
Councillors
| Election | Councillors | |||||||
|---|---|---|---|---|---|---|---|---|
| 2007 | George Nicol Prentice (Ind.) |
Peter Duncan (Conservative) |
Brian Collins (SNP) | |||||
| 2012 | Finlay Carson (Conservative) | |||||||
| 2017 | Ian Howie (Ind.) |
David James (Conservative) |
John Young (SNP) | |||||
| 2022 | Pauline Drysdale (Conservative) | |||||||
Election Results
2017 Election
2017 Dumfries and Galloway Council election[2]
| Party | Candidate | FPv% | Count | ||||||
|---|---|---|---|---|---|---|---|---|---|
| 1 | 2 | 3 | 4 | 5 | 6 | ||||
| Conservative | David James††† | 35.79 | 1,346 | ||||||
| Independent | Iain Howie | 23.96 | 901 | 1,033.99 | |||||
| SNP | John Young | 20.10 | 756 | 761.72 | 772.23 | 837.81 | 928.28 | 1,099.88 | |
| Independent | George Nicol Prentice (incumbent) | 9.70 | 365 | 451.66 | 496.45 | 522.15 | 628.9 | ||
| Labour | Lucy McKie | 7.02 | 264 | 307.03 | 316.87 | 354.5 | |||
| Scottish Green | Paul Taylorson | 3.43 | 129 | 147.66 | 155.77 | ||||
| Electorate: 7,433 Valid: 3,761 Spoilt: 41 Quota: 941 Turnout: 50.6 | |||||||||
2012 Election
2012 Dumfries and Galloway Council election[3]
| Party | Candidate | FPv% | Count | |||||
|---|---|---|---|---|---|---|---|---|
| 1 | 2 | 3 | 4 | 5 | ||||
| Conservative | Finlay Carson | 27.08 | 904 | |||||
| Independent | George Nicol Prentice (incumbent) | 23.88 | 797 | 813 | 826.5 | |||
| SNP | Brian Collins (incumbent) | 23.88 | 797 | 800 | 811.2 | 811.5 | 899.6 | |
| Labour | Daniel Scheffer | 10.04 | 335 | 350.6 | 376.8 | 376.9 | 430.9 | |
| Scottish Green | Paul Taylorson | 6.05 | 202 | 203.2 | 229.4 | 229.6 | ||
| Conservative | Gary Wardell | 5.90 | 197 | 235 | 249.9 | 250.2 | 265 | |
| Liberal Democrats | Andrew Metcalf | 3.18 | 106 | 109 | ||||
| Electorate: 8,014 Valid: 3,338 Spoilt: 34 Quota: 835 Turnout: 3,372 (41.65%) | ||||||||
2007 Election
2007 Dumfries and Galloway Council election[4]
| Party | Candidate | FPv% | Count | ||||||
|---|---|---|---|---|---|---|---|---|---|
| 1 | 2 | 3 | 4 | 5 | 6 | ||||
| Conservative | Peter Duncan | 32.3 | 1,560 | ||||||
| SNP | Brian Collins | 23.9 | 1,152 | 1,165.84 | 1,251.30 | ||||
| Independent | George Nicol Prentice | 18.7 | 904 | 940.99 | 1,006.35 | 1,016.27 | 1,180.89 | 1,536.89 | |
| Liberal Democrats | Alison Mary Barratt | 9.8 | 471 | 487.57 | 606.47 | 620.16 | 719.30 | ||
| Labour | Mike McLurg | 9.4 | 451 | 456.22 | |||||
| Conservative | Alex Zimmerman | 5.9 | 285 | 527.80 | 543.62 | 546.82 | |||
| Electorate: 7,983 Valid: 4,823 Spoilt: 84 Quota: 1,206 Turnout: 61.5% | |||||||||
References
- ↑ "5th Reviews - ward maps". Scottish Boundary Commission. Archived from the original on 20 March 2020. Retrieved 7 March 2020.
- ↑ "Council elections - May 2017". Dumfries and Galloway Council. Retrieved 21 February 2022.
- ↑ "Local Elections Archive Project - 2012 - Dumfries and Galloway". Andrewteale.me.uk. Retrieved 21 February 2022.
- ↑ https://www.gallowaygazette.co.uk/news/dumfries-and-galloway-council-elections-1-334191%5B%5D
This article is issued from Wikipedia. The text is licensed under Creative Commons - Attribution - Sharealike. Additional terms may apply for the media files.
