| Carter Mountain | |
|---|---|
 | |
| Highest point | |
| Elevation | 12,324 ft (3,760 m)[1] |
| Prominence | 1,679 ft (510 m)[1] |
| Coordinates | 44°11′41″N 109°25′08″W / 44.19472°N 109.41889°W[2] |
| Geography | |
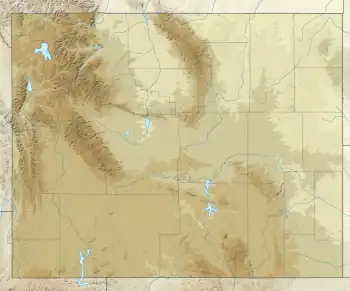
 Carter Mountain Park County, Wyoming, U.S. | |
| Parent range | Absaroka Range |
| Topo map | USGS Aldrich Basin |
Carter Mountain (12,324 ft (3,760 m)) is in Shoshone National Forest in the U.S. state of Wyoming.[3] Carter Mountain slopes gently up from the Bighorn Basin to the east but has steep cliffs on its western face. The region is well known for large herds of bighorn sheep, pronghorn and elk.

Carter Mountain, west aspect
Climate
| Climate data for Carter Mountain 44.1939 N, 109.4176 W, Elevation: 11,913 ft (3,631 m) (1991–2020 normals) | |||||||||||||
|---|---|---|---|---|---|---|---|---|---|---|---|---|---|
| Month | Jan | Feb | Mar | Apr | May | Jun | Jul | Aug | Sep | Oct | Nov | Dec | Year |
| Mean daily maximum °F (°C) | 19.1 (−7.2) |
18.4 (−7.6) |
23.4 (−4.8) |
29.1 (−1.6) |
38.3 (3.5) |
48.5 (9.2) |
58.7 (14.8) |
57.8 (14.3) |
48.9 (9.4) |
36.2 (2.3) |
24.4 (−4.2) |
18.4 (−7.6) |
35.1 (1.7) |
| Daily mean °F (°C) | 9.8 (−12.3) |
8.2 (−13.2) |
12.6 (−10.8) |
17.5 (−8.1) |
26.2 (−3.2) |
35.7 (2.1) |
44.8 (7.1) |
44.1 (6.7) |
35.9 (2.2) |
24.7 (−4.1) |
15.2 (−9.3) |
9.4 (−12.6) |
23.7 (−4.6) |
| Mean daily minimum °F (°C) | 0.5 (−17.5) |
−1.9 (−18.8) |
1.9 (−16.7) |
5.8 (−14.6) |
14.1 (−9.9) |
22.9 (−5.1) |
30.9 (−0.6) |
30.3 (−0.9) |
22.8 (−5.1) |
13.2 (−10.4) |
6.0 (−14.4) |
0.4 (−17.6) |
12.2 (−11.0) |
| Average precipitation inches (mm) | 1.61 (41) |
1.65 (42) |
2.82 (72) |
4.23 (107) |
5.69 (145) |
3.32 (84) |
1.92 (49) |
1.73 (44) |
2.72 (69) |
2.98 (76) |
2.21 (56) |
2.03 (52) |
32.91 (837) |
| Source: PRISM Climate Group[4] | |||||||||||||
References
- 1 2 "Carter Mountain, Wyoming". Peakbagger.com. Retrieved June 23, 2017.
- ↑ "Carter Mountain". Geographic Names Information System. United States Geological Survey, United States Department of the Interior. Retrieved June 23, 2017.
- ↑ Aldrich Basin, WY (Map). TopoQwest (United States Geological Survey Maps). Retrieved June 23, 2017.
- ↑ "PRISM Climate Group, Oregon State University". PRISM Climate Group, Oregon State University. Retrieved October 12, 2023.
To find the table data on the PRISM website, start by clicking Coordinates (under Location); copy Latitude and Longitude figures from top of table; click Zoom to location; click Precipitation, Minimum temp, Mean temp, Maximum temp; click 30-year normals, 1991-2020; click 800m; click Retrieve Time Series button.
This article is issued from Wikipedia. The text is licensed under Creative Commons - Attribution - Sharealike. Additional terms may apply for the media files.