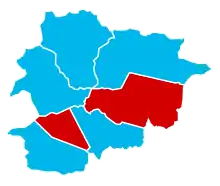
The 2003 Andorran local elections were held on 14 December. Voters elected the council members of the seven parishes.[1]

Electoral system
Voters elect the members of the municipal councils (consells de comú in Catalan). The electoral law allows the municipal councils to choose their numbers of seats, which must be an even number between 10 and 16.
All city council members were elected in single multi-member districts, consisting of the whole parish, using closed lists. Half of the seats were allocated to the party with the most votes. The other half of the seats were allocated using the Hare quota (including the winning party). With this system the winning party obtained an absolute majority.
The cònsol major (mayor) and the cònsol menor (deputy mayor) were elected indirectly by the municipal councillors.[2]
Results
Overall
| Party | Votes | % | Seats | |
|---|---|---|---|---|
| Liberal Party of Andorra | 4,466 | 40.8 | 48 | |
| Social Democratic Party | 3,695 | 33.8 | 21 | |
| Liberal Party of Andorra–Andorran Democratic Center | 758 | 6.9 | 3 | |
| Century 21 (political party) | 685 | 6.3 | 3 | |
| Andorran Democratic Center | 439 | 4.0 | 0 | |
| Parochial Democratic Group | 393 | 3.6 | 2 | |
| Parochial Union of Independents Group | 283 | 2.6 | 2 | |
| Union for Canillo | 228 | 2.1 | 3 | |
| Blank votes | 748 | – | – | |
| Invalid votes | 64 | – | – | |
| Total | 11,759 | 100 | 82 | |
| Registered voters/turnout | 15,053 | 78.1 | – | |
The Liberal Party was the most voted party, winning in 5 out of 7 parishes. These results confirmed the establishment of a two-party system.[1]
Canillo
| Party | Votes | % | Seats | |
|---|---|---|---|---|
| Liberal Party of Andorra | 267 | 53.9 | 11 | |
| Union for Canillo | 228 | 46.1 | 3 | |
| Blank votes | 17 | – | – | |
| Invalid votes | 1 | – | – | |
| Total | 513 | 100 | 14 | |
| Registered voters/turnout | 583 | 88.0 | – | |
Encamp
| Party | Votes | % | Seats | |
|---|---|---|---|---|
| Social Democratic Party | 787 | 50.9 | 9 | |
| Liberal Party of Andorra–Andorran Democratic Center | 758 | 49.1 | 3 | |
| Blank votes | 84 | – | – | |
| Invalid votes | 20 | – | – | |
| Total | 1,649 | 100 | 12 | |
| Registered voters/turnout | 2,057 | 80.2 | – | |
Ordino
| Party | Votes | % | Seats | |
|---|---|---|---|---|
| Liberal Party of Andorra | 377 | 57.1 | 8 | |
| Parochial Union of Independents Group | 283 | 42.9 | 2 | |
| Blank votes | 70 | – | – | |
| Invalid votes | 2 | – | – | |
| Total | 732 | 100 | 10 | |
| Registered voters/turnout | 871 | 84.0 | – | |
La Massana
| Party | Votes | % | Seats | |
|---|---|---|---|---|
| Liberal Party of Andorra | 562 | 47.4 | 8 | |
| Parochial Democratic Group | 393 | 33.2 | 2 | |
| Social Democratic Party | 230 | 19.4 | 0 | |
| Blank votes | 44 | – | – | |
| Invalid votes | 2 | – | – | |
| Total | 1,231 | 100 | 10 | |
| Registered voters/turnout | 1,427 | 86.3 | – | |
Andorra la Vella
| Party | Votes | % | Seats | |
|---|---|---|---|---|
| Social Democratic Party | 1,350 | 43.7 | 9 | |
| Liberal Party of Andorra | 1,298 | 42.0 | 3 | |
| Andorran Democratic Center | 439 | 14.2 | 0 | |
| Blank votes | 207 | – | – | |
| Invalid votes | 12 | – | – | |
| Total | 3,306 | 100 | 12 | |
| Registered voters/turnout | 4,555 | 72.6 | – | |
Sant Julià de Lòria
| Party | Votes | % | Seats | |
|---|---|---|---|---|
| Lauredian Union–Liberal Party of Andorra | 809 | 47.9 | 9 | |
| Century 21 | 685 | 40.5 | 3 | |
| Social Democratic Party | 196 | 11.6 | 0 | |
| Blank votes | 94 | – | – | |
| Invalid votes | 4 | – | – | |
| Total | 1,788 | 100 | 12 | |
| Registered voters/turnout | 2,242 | 79.8 | – | |
Escaldes-Engordany
| Party | Votes | % | Seats | |
|---|---|---|---|---|
| Liberal Party of Andorra | 1,153 | 50.5 | 9 | |
| Social Democratic Party | 1,132 | 49.5 | 3 | |
| Blank votes | 232 | – | – | |
| Invalid votes | 23 | – | – | |
| Total | 2,540 | 100 | 12 | |
| Registered voters/turnout | 3,318 | 76.6 | – | |
References
- 1 2 Anuaris.cat: Andorra amb rumb a Europa
- ↑ "Decret legislatiu del 26-11-2014 pel que s'aprova el text refós de la Llei qualificada del règim electoral i del referèndum" (in Catalan). Govern d'Andorra. Retrieved 2015-12-10.