| ||||||||||||||||||||||||||||||||||||||
All 66 seats in the Landtag of Mecklenburg-Vorpommern 34 seats needed for a majority | ||||||||||||||||||||||||||||||||||||||
|---|---|---|---|---|---|---|---|---|---|---|---|---|---|---|---|---|---|---|---|---|---|---|---|---|---|---|---|---|---|---|---|---|---|---|---|---|---|---|
| Turnout | 895,999 (64.7%) | |||||||||||||||||||||||||||||||||||||
| ||||||||||||||||||||||||||||||||||||||
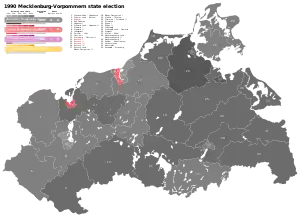
 Results for the single-member constituencies | ||||||||||||||||||||||||||||||||||||||
| ||||||||||||||||||||||||||||||||||||||
The 1990 Mecklenburg-Vorpommern state election was held on 14 October 1990 to elect the members of the first Landtag of Mecklenburg-Vorpommern. It was the first election held in Mecklenburg-Vorpommern since the reunification of Germany, which took place on 3 October. The Christian Democratic Union (CDU) led by Alfred Gomolka emerged as the largest party with 38.3% of the vote, followed by the Social Democratic Party (SPD) with 27.0%. The CDU subsequently formed a coalition with the Free Democratic Party (FDP), and Gomolka became Mecklenburg-Vorpommern's first post-reunification Minister-President.
Parties
The table below lists parties which won seats in the election.
| Name | Ideology | Leader(s) | ||
|---|---|---|---|---|
| CDU | Christian Democratic Union of Germany Christlich Demokratische Union Deutschlands |
Christian democracy | Alfred Gomolka | |
| SPD | Social Democratic Party of Germany Sozialdemokratische Partei Deutschlands |
Social democracy | Klaus Klingner | |
| PDS | Party of Democratic Socialism Partei des Demokratischen Sozialismus |
Democratic socialism | ||
| FDP | Free Democratic Party Freie Demokratische Partei |
Classical liberalism | ||
Election result
| Party | Votes | % | Seats | Seats % | |||
|---|---|---|---|---|---|---|---|
| Christian Democratic Union (CDU) | 343,447 | 38.3 | 29 | 43.9 | |||
| Social Democratic Party (SPD) | 242,147 | 27.0 | 21 | 31.8 | |||
| Party of Democratic Socialism (PDS) | 140,397 | 15.7 | 12 | 18.2 | |||
| Free Democratic Party (FDP) | 49,104 | 5.5 | 4 | 6.1 | |||
| The Greens (Grüne) | 37,336 | 4.2 | 0 | 0 | |||
| New Forum (NF) | 26,230 | 2.9 | 0 | 0 | |||
| Alliance 90 (B90) | 19,948 | 2.2 | 0 | 0 | |||
| Christian Social Union (CSU) | 9,975 | 1.1 | 0 | 0 | |||
| Others | 27,415 | 3.1 | 0 | 0 | |||
| Total | 895,999 | 100.0 | 66 | ||||
| Voter turnout | 64.7 | ||||||
Sources
This article is issued from Wikipedia. The text is licensed under Creative Commons - Attribution - Sharealike. Additional terms may apply for the media files.
