| Virginia's 2nd congressional district | |||
|---|---|---|---|
Interactive map of district boundaries since 2023 | |||
| Representative |
| ||
| Distribution |
| ||
| Population (2022) | 780,161[2] | ||
| Median household income | $83,535[3] | ||
| Ethnicity |
| ||
| Cook PVI | R+2[4] | ||
.png.webp)
Virginia's second congressional district is a U.S. congressional district in the Commonwealth of Virginia. It currently encompasses all of Accomack, Northampton, and Isle of Wight; all of the independent cities of Virginia Beach, Suffolk, and Franklin; part of the independent city of Chesapeake; and part of Southampton. However, its boundaries have changed greatly over the centuries; it initially encompassed what became West Virginia after the American Civil War. It is considered among the nation's most competitive congressional districts.
The district has a significant military presence.[5] The Hampton Roads area is considered to be a military town.[6]
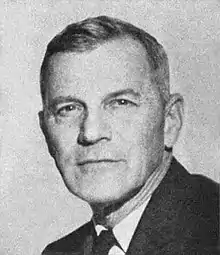
Republican Scott Rigell defeated Democrat Glenn Nye in the November 2, 2010, election, and took his seat January 3, 2011, serving until 2017, when he was succeeded by Scott Taylor. In the November 6, 2018, election, Democrat Elaine Luria defeated Republican Scott Taylor. In 2022, Luria was defeated by Republican Jen Kiggans, thereby making the district one of 18 that would have voted for Joe Biden in the 2020 presidential election had they existed in their current configuration while being won or held by a Republican in 2022.
The responsibility of drawing maps for congressional and state legislative districts passed from the Virginia Redistricting Commission (VRC) to the Supreme Court of Virginia in November 2021. The Supreme Court completed redistricting in December 2021, which was used for the 2022 elections.[7]
Recent results in statewide races
- Results under current lines (since 2023)
| Year | Office | Results |
|---|---|---|
| 2016 | President | Trump 49.8%–44.3% |
| 2017 | Governor | Northam 50.4%-48.5% |
| Lieutenant Governor | Vogel 52.2%-47.7% | |
| Attorney General | Adams 51.1%–48.8% | |
| 2018 | Senator | Kaine 52.6%-45.4% |
| 2020 | President | Biden 50.0%-48.0% |
| Senator | Warner 52.0%-47.9% | |
| 2021 | Governor | Youngkin 55.1%-44.2% |
| Lieutenant Governor | Sears 55.6%-44.3% | |
| Attorney General | Miyares 55.1%-44.8% |
- Results under old lines
List of members representing the district
Election results
1980s
| Party | Candidate | Votes | % | |
|---|---|---|---|---|
| Republican | G. William Whitehurst (Incumbent) | 97,319 | 89.84% | |
| Independent | Kenneth P. Morrison | 11,003 | 10.16% | |
| Write-in | 6 | 0.01% | ||
| Total votes | 108,328 | 100% | ||
| Republican hold | ||||
| Party | Candidate | Votes | % | |
|---|---|---|---|---|
| Republican | G. William Whitehurst (Incumbent) | 78,108 | 99.88% | |
| Write-in | 97 | 0.12% | ||
| Total votes | 78,205 | 100% | ||
| Republican hold | ||||
| Party | Candidate | Votes | % | |
|---|---|---|---|---|
| Republican | G. William Whitehurst (Incumbent) | 136,632 | 99.81% | |
| Write-in | 256 | 0.19% | ||
| Total votes | 136,888 | 100% | ||
| Republican hold | ||||
| Party | Candidate | Votes | % | |||
|---|---|---|---|---|---|---|
| Democratic | Owen B. Pickett | 54,491 | 49.46% | |||
| Republican | A. Joe Canada Jr. | 46,137 | 41.88% | |||
| Independent | Stephen P. Shao | 9,492 | 8.62% | |||
| Write-in | 49 | 0.04% | ||||
| Total votes | 110,169 | 100% | ||||
| Democratic gain from Republican | ||||||
| Party | Candidate | Votes | % | |
|---|---|---|---|---|
| Democratic | Owen B. Pickett (Incumbent) | 106,666 | 60.53% | |
| Republican | Jerry R. Curry | 62,564 | 35.51% | |
| Independent | Stephen P. Shao | 4,255 | 2.41% | |
| Independent | Robert A. Smith | 2,691 | 1.53% | |
| Write-in | 32 | 0.02% | ||
| Total votes | 176,208 | 100% | ||
| Democratic hold | ||||
1990s
| Party | Candidate | Votes | % | |
|---|---|---|---|---|
| Democratic | Owen B. Pickett (Incumbent) | 55,179 | 74.95% | |
| Independent | Harry G. Broskie | 15,915 | 21.62% | |
| Write-in | 2,524 | 3.43% | ||
| Total votes | 73,618 | 100% | ||
| Democratic hold | ||||
| Party | Candidate | Votes | % | |
|---|---|---|---|---|
| Democratic | Owen B. Pickett (Incumbent) | 99,253 | 56.03% | |
| Republican | J. L. Chapman IV | 77,797 | 43.92% | |
| Write-in | 83 | 0.05% | ||
| Total votes | 177,133 | 100% | ||
| Democratic hold | ||||
| Party | Candidate | Votes | % | |
|---|---|---|---|---|
| Democratic | Owen B. Pickett (Incumbent) | 81,372 | 59.05% | |
| Republican | J. L. Chapman IV | 56,375 | 40.91% | |
| Write-in | 55 | 0.04% | ||
| Total votes | 137,802 | 100% | ||
| Democratic hold | ||||
| Party | Candidate | Votes | % | |
|---|---|---|---|---|
| Democratic | Owen B. Pickett (Incumbent) | 106,215 | 64.77% | |
| Republican | John F. Tate | 57,586 | 35.11% | |
| Write-in | 195 | 0.12% | ||
| Total votes | 163,996 | 100% | ||
| Democratic hold | ||||
| Party | Candidate | Votes | % | |
|---|---|---|---|---|
| Democratic | Owen B. Pickett (Incumbent) | 67,975 | 94.29% | |
| Write-in | 4,116 | 5.71% | ||
| Total votes | 72,091 | 100% | ||
| Democratic hold | ||||
2000s
| Party | Candidate | Votes | % | |||
|---|---|---|---|---|---|---|
| Republican | Edward L. Schrock | 97,856 | 51.96% | |||
| Democratic | Jody M. Wagner | 90,328 | 47.96% | |||
| Write-in | 145 | 0.08% | ||||
| Total votes | 188,329 | 100% | ||||
| Republican gain from Democratic | ||||||
| Party | Candidate | Votes | % | |
|---|---|---|---|---|
| Republican | Edward L. Schrock (Incumbent) | 103,807 | 83.15% | |
| Green | D. C. Amarasinghe | 20,589 | 16.49% | |
| Write-in | 450 | 0.36% | ||
| Total votes | 124,846 | 100% | ||
| Republican hold | ||||
| Party | Candidate | Votes | % | |
|---|---|---|---|---|
| Republican | Thelma D. Drake | 132,946 | 55.08% | |
| Democratic | David B. Ashe | 108,180 | 44.82% | |
| Write-in | 254 | 0.11% | ||
| Total votes | 241,380 | 100% | ||
| Republican hold | ||||
| Party | Candidate | Votes | % | |
|---|---|---|---|---|
| Republican | Thelma D. Drake (Incumbent) | 88,777 | 51.27% | |
| Democratic | Phil Kellam | 83,901 | 48.45% | |
| Write-in | 481 | 0.28% | ||
| Total votes | 173,159 | 100% | ||
| Republican hold | ||||
| Party | Candidate | Votes | % | |||
|---|---|---|---|---|---|---|
| Democratic | Glenn Nye | 141,857 | 52.40% | |||
| Republican | Thelma D. Drake (Incumbent) | 128,486 | 47.46% | |||
| Write-in | 368 | 0.14% | ||||
| Total votes | 270,711 | 100% | ||||
| Democratic gain from Republican | ||||||
2010s
| Party | Candidate | Votes | % | |||
|---|---|---|---|---|---|---|
| Republican | E. Scott Rigell | 88,340 | 53.12% | |||
| Democratic | Glenn Nye (Incumbent) | 70,591 | 42.45% | |||
| Independent | Kenny E. Golden | 7,194 | 4.33% | |||
| Write-in | 164 | 0.10% | ||||
| Total votes | 166,289 | 100% | ||||
| Republican gain from Democratic | ||||||
| Party | Candidate | Votes | % | |
|---|---|---|---|---|
| Republican | E. Scott Rigell (Incumbent) | 166,231 | 53.76% | |
| Democratic | Paul O. Hirschbiel, Jr. | 142,548 | 46.10% | |
| Write-in | 443 | 0.14% | ||
| Total votes | 309,222 | 100% | ||
| Republican hold | ||||
| Party | Candidate | Votes | % | |
|---|---|---|---|---|
| Republican | E. Scott Rigell (Incumbent) | 101,558 | 58.68% | |
| Democratic | Suzanne Patrick | 71,178 | 41.13% | |
| Write-in | 324 | 0.19% | ||
| Total votes | 173,060 | 100% | ||
| Republican hold | ||||
| Party | Candidate | Votes | % | |
|---|---|---|---|---|
| Republican | Scott Taylor | 190,475 | 61.33% | |
| Democratic | Shaun D. Brown | 119,440 | 38.46% | |
| Write-in | 652 | 0.21% | ||
| Total votes | 310,567 | 100.00% | ||
| Republican hold | ||||
| Party | Candidate | Votes | % | |||
|---|---|---|---|---|---|---|
| Democratic | Elaine Luria | 139,571 | 51.05% | |||
| Republican | Scott Taylor (Incumbent) | 133,458 | 48.81% | |||
| Write-in | 371 | 0.14% | ||||
| Total votes | 273,400 | 100.00% | ||||
| Democratic gain from Republican | ||||||
2020s
| Party | Candidate | Votes | % | |
|---|---|---|---|---|
| Democratic | Elaine Luria (Incumbent) | 185,733 | 51.55% | |
| Republican | Scott Taylor | 165,031 | 45.81% | |
| Independent | David Foster | 9,170 | 2.55% | |
| Write-in | 343 | 0.10% | ||
| Total votes | 360,277 | 100.00% | ||
| Democratic hold | ||||
| Party | Candidate | Votes | % | |
|---|---|---|---|---|
| Republican | Jen Kiggans | 153,328 | 51.6% | |
| Democratic | Elaine Luria (Incumbent) | 143,219 | 48.2% | |
| Write-in | 449 | 0.2% | ||
| Total votes | 296,996 | 100.00% | ||
| Republican gain from Democratic | ||||
Historical district boundaries
The Virginia Second District started in 1788 covering the counties of Mercer, Jefferson, Fayette, Bourbon, Lincoln, Nelson and Madison.[34]

.tif.png.webp)
.png.webp)
See also
References
- ↑ Geography, US Census Bureau. "Congressional Districts Relationship Files (state-based)". www.census.gov.
- ↑ Bureau, Center for New Media & Promotion (CNMP), US Census. "My Congressional District". www.census.gov.
{{cite web}}: CS1 maint: multiple names: authors list (link) - ↑ "My Congressional District".
- ↑ "2022 Cook PV: District Map and List". The Cook Political Report. July 12, 2022. Retrieved January 5, 2023.
- ↑ "Military Posts". American Communities Project. Retrieved November 22, 2022.
- ↑ "Naval Air Station Oceana | Base Overview & Info | MilitaryINSTALLATIONS". installations.militaryonesource.mil. Retrieved November 22, 2022.
- ↑ Virginia Redistricting Commission. "Virginia Redistricting Commission". Retrieved June 17, 2022.
- 1 2 "November 5, 1996 General Election For Office of PRESIDENT/VICE PRESIDENT of the United States". Virginia State Board of Elections. Archived from the original on December 28, 2012. Retrieved December 21, 2012.
- 1 2 3 "NOVEMBER 4, 1997 GENERAL ELECTION For Office of Governor". Virginia State Board of Elections. Archived from the original on December 28, 2012. Retrieved December 21, 2012.
- 1 2 "November 7th - General Election". Virginia State Board of Elections. November 20, 2000. Archived from the original on December 29, 2012. Retrieved December 21, 2012.
- 1 2 3 "Official Results: Governor". Virginia State Board of Elections. Archived from the original on December 29, 2012. Retrieved December 21, 2012.
- ↑ "Official Results: Senate". Virginia State Board of Elections. Archived from the original on December 28, 2012. Retrieved December 21, 2012.
- ↑ "November 2nd - General Election Official Results". Virginia State Board of Elections. Archived from the original on December 29, 2012. Retrieved December 21, 2012.
- 1 2 3 "November 2005 Official Results". Virginia State Board of Elections. Archived from the original on December 28, 2012. Retrieved July 6, 2013.
- ↑ "November 2006 Official Results". Virginia State Board of Elections. Retrieved July 6, 2013.
- 1 2 "November 2008 Official Results". Virginia State Board of Elections. Archived from the original on March 4, 2016. Retrieved December 21, 2012.
- ↑ "November 2009 Official Results". Virginia State Board of Elections. Archived from the original on April 1, 2012. Retrieved July 6, 2013.
- 1 2 "November 2009 Official Results". Virginia State Board of Elections. Archived from the original on January 11, 2014. Retrieved July 6, 2013.
- 1 2 "November 2012 Official Results". Virginia State Board of Elections. Archived from the original on August 9, 2016. Retrieved July 6, 2013.
- ↑ "Governor>Votes by District". November 2013 General Election Official Results. Virginia State Board of Elections. Retrieved July 5, 2020.
- ↑ "Lieutenant Governor>Votes by District". November 2013 General Election Official Results. Virginia State Board of Elections. Retrieved July 5, 2020.
- ↑ "Attorney General>Votes by District". November 2013 General Election Official Results. Virginia State Board of Elections. Retrieved July 5, 2020.
- ↑ "Turnout by Congressional District". The Virginia Public Access Project. Retrieved July 4, 2020.
- ↑ "Daily Kos Elections presents the 2016 presidential election results by congressional district".
- ↑ "2017 Governor's Election Results by Congressional District". The Virginia Public Access Project. Retrieved June 16, 2018.
- ↑ "2018 U.S. Senate Results by Congressional District". The Virginia Public Access Project. Retrieved June 16, 2018.
- ↑ "Daily Kos Elections' presidential results by congressional district for 2020, 2016, and 2012".
- ↑ @greggiroux (November 16, 2021). "Certified results of Virginia governor's election by current congressional district:" (Tweet) – via Twitter.
- ↑ "Election Results | Virginia Department of Elections". Archived from the original on November 7, 2014. Retrieved November 27, 2014.
- ↑ "2016 November General Congress". Virginia State Board of Elections. Retrieved November 24, 2016.
- ↑ "2018 November General Congress". Virginia State Board of Elections. Archived from the original on November 8, 2018. Retrieved December 7, 2018.
- ↑ "2020 November General Official Results". Virginia Department of Elections. November 11, 2020. Archived from the original on February 3, 2021. Retrieved December 15, 2020.
- ↑ "2022 November General". November 8, 2022. Retrieved November 8, 2022.
- ↑ Statute of 20 November 1788
- Martis, Kenneth C. (1989). The Historical Atlas of Political Parties in the United States Congress. New York: Macmillan Publishing Company.
- Martis, Kenneth C. (1982). The Historical Atlas of United States Congressional Districts. New York: Macmillan Publishing Company.
- Congressional Biographical Directory of the United States 1774–present
.svg.png.webp)




.png.webp)
_in_1916_(cropped).jpg.webp)
.jpg.webp)

