| Texas's 28th congressional district | |||
|---|---|---|---|
.tif.png.webp) Texas's 28th congressional district since January 3, 2023 | |||
| Representative |
| ||
| Distribution |
| ||
| Population (2022) | 777,758[2] | ||
| Median household income | $60,356[2] | ||
| Ethnicity |
| ||
| Cook PVI | D+3[3] | ||
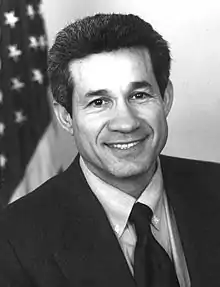
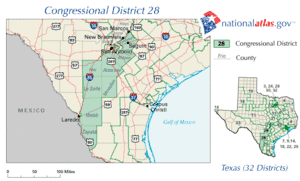
Texas's 28th congressional district of the United States House of Representatives covers a strip in deep south Texas starting in the eastern outskirts of San Antonio, and ending at the U.S.–Mexico border. Towns entirely or partially within this district include Converse, Laredo, Rio Grande City, and Universal City. The current Representative from the 28th district is Henry Cuellar.
Election results from recent statewide races
Results under current lines (since 2023)[4]
| Year | Office | Result |
|---|---|---|
| 2014 | Senate | Alameel 51 - 49% |
| Governor | Davis 55 - 45% | |
| 2016 | President | Clinton 57 - 38% |
| 2018 | Senate | O’Rourke 59 - 40% |
| Governor | Valdez 53 - 46% | |
| Lieutenant Governor | Collier 57 - 41% | |
| Attorney General | Nelson 59 - 39% | |
| 2020 | President | Biden 53 - 46% |
| Senate | Hegar 52 - 45% | |
| 2022 | Governor | O’Rourke 52 - 46% |
| Lieutenant Governor | Collier 50 - 46% | |
| Attorney General | Garza 52 - 45% [5] | |
List of members representing the district
Recent election results
2004 election
| Party | Candidate | Votes | % | ±% | |
|---|---|---|---|---|---|
| Democratic | Henry Cuellar | 106,323 | 59.0 | -12.1 | |
| Republican | James Hopson | 69,538 | 38.6 | +11.7 | |
| Libertarian | Ken Ashby | 4,305 | 2.4 | +0.3 | |
| Majority | 36,785 | 20.4 | |||
| Turnout | 180,166 | ||||
| Democratic hold | Swing | -11.9 | |||
2006 election
On June 28, 2006, the U.S. Supreme Court declared that the Texas legislature's redistricting plan violated the Voting Rights Act in the case of Texas's 23rd congressional district. As a result, on August 4, 2006, a three-judge panel announced replacement district boundaries for 2006 election for the 23rd district, which affected the boundaries of the 15th, 21st, 25th and 28th districts.
On election day in November, these five districts had open primaries, or a "jungle primary"; any candidate to receive more than 50% of the vote wins the seat. Otherwise, a runoff election in December will decide the seat.[8]
Cuellar retained his seat in the 28th district.
2008 election
| Party | Candidate | Votes | % | ±% | |
|---|---|---|---|---|---|
| Democratic | Henry Cuellar (incumbent) | 123,494 | 68.7 | +9.7 | |
| Republican | Jim Fish | 52,524 | 29.2 | -9.38 | |
| Libertarian | Ross Lynn Leone | 3,722 | 2.1 | -0.3 | |
| Majority | 70,969 | ||||
| Turnout | 179,740 | ||||
| Democratic hold | Swing | +10.0 | |||
2010 election
| Party | Candidate | Votes | % | ±% | |
|---|---|---|---|---|---|
| Democratic | Henry Cuellar (incumbent) | 62,773 | 56.34 | -12.4 | |
| Republican | Bryan Underwood | 46,740 | 41.95 | +12.75 | |
| Libertarian | Stephen Kaat | 1,889 | 1.7 | -0.4 | |
| Majority | 14,144 | 12.69 | |||
| Turnout | 111,402 | ||||
| Democratic hold | Swing | ||||
2012 election
| Party | Candidate | Votes | % | |
|---|---|---|---|---|
| Democratic | Henry Cuellar (Incumbent) | 112,456 | 67.89 | |
| Republican | William R. Hayward | 49,309 | 29.77 | |
| Libertarian | Patrick Hisel | 2,473 | 1.49 | |
| Green | Michael D. Cary | 1,407 | 0.85 | |
| Total votes | 165,645 | 100.0 | ||
2014 election
| Party | Candidate | Votes | % | ±% | |
|---|---|---|---|---|---|
| Democratic | Henry Cuellar (incumbent) | 62,508 | 82.1 | ||
| Libertarian | Will Alkens | 10,153 | 13.3 | ||
| Green | Michael Cary | 3,475 | 4.6 | ||
| Majority | |||||
| Turnout | 76,136 | 100 | |||
| Democratic hold | Swing | ||||
2016 election
| Party | Candidate | Votes | % | ±% | |
|---|---|---|---|---|---|
| Democratic | Henry Cuellar (incumbent) | 122,086 | 66.2 | ||
| Republican | Zeffen Hardin | 57,740 | 31.3 | ||
| Green | Michael Cary | 4,616 | 2.5 | ||
| Majority | |||||
| Turnout | 184,442 | 100 | |||
| Democratic hold | Swing | ||||
2018 election
| Party | Candidate | Votes | % | |
|---|---|---|---|---|
| Democratic | Henry Cuellar (incumbent) | 117,494 | 84.4 | |
| Libertarian | Arthur Thomas IV | 21,732 | 15.6 | |
| Total votes | 139,226 | 100 | ||
| Democratic hold | ||||
2020 election
| Party | Candidate | Votes | % | |
|---|---|---|---|---|
| Democratic | Henry Cuellar (incumbent) | 137,494 | 58.3 | |
| Republican | Sandra Whitten | 91,925 | 39.0 | |
| Libertarian | Bekah Congdon | 6,425 | 2.7 | |
| Total votes | 235,844 | 100.0 | ||
| Democratic hold | ||||
2022 election
| Party | Candidate | Votes | % | |
|---|---|---|---|---|
| Democratic | Henry Cuellar (incumbent) | 93,803 | 56.6 | |
| Republican | Cassy Garcia | 71,778 | 43.3 | |
| Total votes | 165,581 | 100.0 | ||
| Democratic hold | ||||
See also
References
- ↑ "Congressional Districts Relationship Files (State-based)". U.S. Census Bureau. Archived from the original on April 2, 2013.
- 1 2 Center for New Media & Promotion (CNMP), US Census Bureau. "My Congressional District". www.census.gov. Retrieved October 6, 2023.
- ↑ "2022 Cook PVI: District Map and List". Cook Political Report. Retrieved January 10, 2023.
- ↑ "2022 Cook PVI: District Map and List". Cook Political Report. Retrieved January 23, 2023.
- ↑ "TX 2022 Congressional". Dave’s Redistricting App. Retrieved July 15, 2023.
- ↑ "District Population Analysis with County Subtotals | CONGRESSIONAL DISTRICTS - PLANC2100" (PDF). Capitol Data Portal. Texas Legislative Council. August 26, 2021. Archived (PDF) from the original on June 27, 2022. Retrieved January 1, 2023.
- ↑ "District Population Analysis with County Subtotals | CONGRESSIONAL DISTRICTS - PLANC2193" (PDF). Capitol Data Portal. Texas Legislative Council. October 17, 2021. Archived (PDF) from the original on December 25, 2022. Retrieved January 1, 2023.
- ↑ "Austin American-Statesman". August 4, 2006.
- ↑ "Office of the Secretary of State Race Summary Report 2012 General Election". Texas Secretary of State. Retrieved March 31, 2013.
- ↑ "Texas Election Results". Texas Secretary of State. Retrieved December 5, 2018.
- ↑ "Texas Election Results - Official Results". Texas Secretary of State. Retrieved November 26, 2020.


.tif.png.webp)
.tif.png.webp)