In physics, the spin–spin relaxation is the mechanism by which Mxy, the transverse component of the magnetization vector, exponentially decays towards its equilibrium value in nuclear magnetic resonance (NMR) and magnetic resonance imaging (MRI). It is characterized by the spin–spin relaxation time, known as T2, a time constant characterizing the signal decay.[1] [2] [3] It is named in contrast to T1, the spin–lattice relaxation time. It is the time it takes for the magnetic resonance signal to irreversibly decay to 37% (1/e) of its initial value after its generation by tipping the longitudinal magnetization towards the magnetic transverse plane.[4] Hence the relation
- .
T2 relaxation generally proceeds more rapidly than T1 recovery, and different samples and different biological tissues have different T2. For example, fluids have the longest T2 (on the order of seconds for protons), and water based tissues are in the 40–200 ms range, while fat based tissues are in the 10–100 ms range. Amorphous solids have T2 in the range of milliseconds, while the transverse magnetization of crystalline samples decays in around 1/20 ms.
Origin
When excited nuclear spins—i.e., those lying partially in the transverse plane—interact with each other by sampling local magnetic field inhomogeneities on the micro- and nanoscales, their respective accumulated phases deviate from expected values.[4] While the slow- or non-varying component of this deviation is reversible, some net signal will inevitably be lost due to short-lived interactions such as collisions and random processes such as diffusion through heterogeneous space.
T2 decay does not occur due to the tilting of the magnetization vector away from the transverse plane. Rather, it is observed due to the interactions of an ensemble of spins dephasing from each other.[5] Unlike spin-lattice relaxation, considering spin-spin relaxation using only a single isochromat is trivial and not informative.
Determining parameters

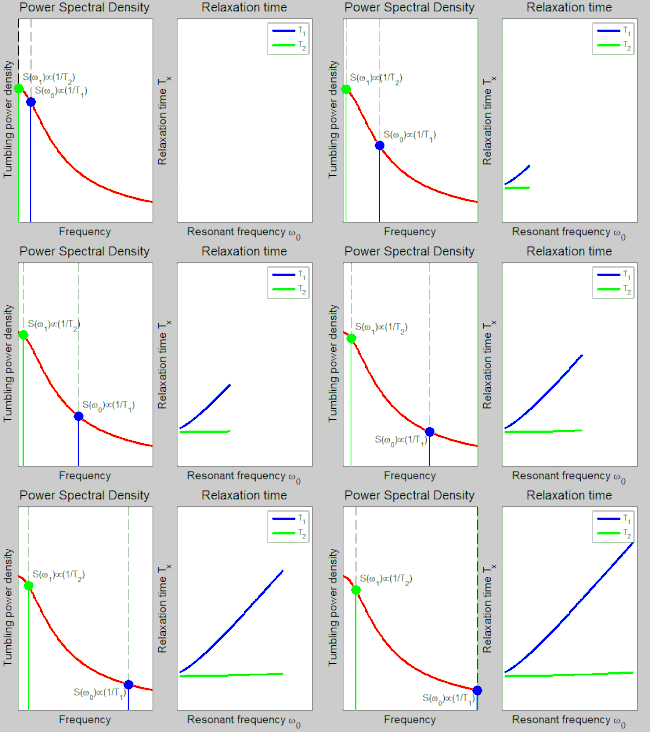
Like spin-lattice relaxation, spin-spin relaxation can be studied using a molecular tumbling autocorrelation framework.[6] The resulting signal decays exponentially as the echo time (TE), i.e., the time after excitation at which readout occurs, increases. In more complicated experiments, multiple echoes can be acquired simultaneously in order to quantitatively evaluate one or more superimposed T2 decay curves.[6] The relaxation rate experienced by a spin, which is the inverse of T2, is proportional to a spin's tumbling energy at the frequency difference between one spin and another; in less mathematical terms, energy is transferred between two spins when they rotate at a similar frequency to their beat frequency, in the figure at right.[6] In that the beat frequency range is very small relative to the average rotation rate , spin-spin relaxation is not heavily dependent on magnetic field strength. This directly contrasts with spin-lattice relaxation, which occurs at tumbling frequencies equal to the Larmor frequency .[7] Some frequency shifts, such as the NMR chemical shift, occur at frequencies proportional to the Larmor frequency, and the related but distinct parameter T2* can be heavily dependent on field strength due to the difficulty of correcting for inhomogeneity in stronger magnet bores.[4]

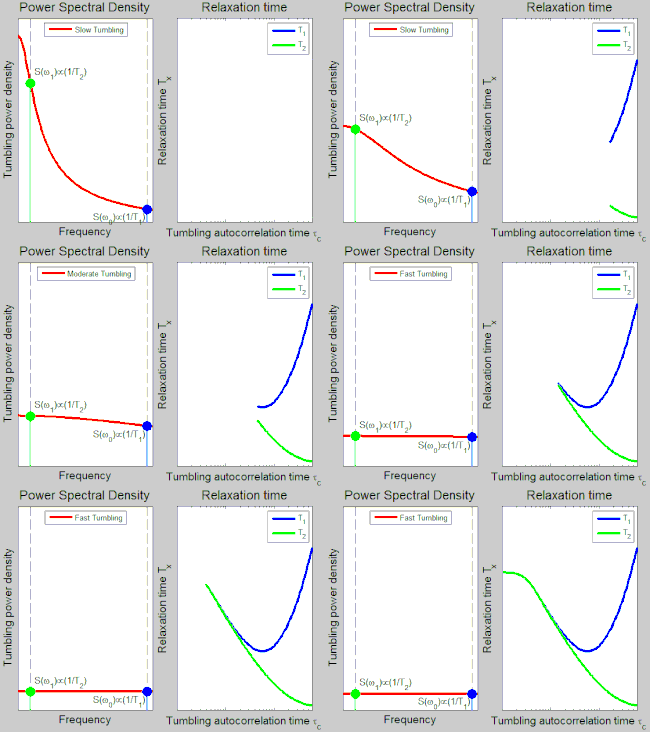
Assuming isothermal conditions, spins tumbling faster through space will generally have a longer T2. Since slower tumbling displaces the spectral energy at high tumbling frequencies to lower frequencies, the relatively low beat frequency will experience a monotonically increasing amount of energy as increases, decreasing relaxation time.[6] The figure at the left illustrates this relationship. It is worth noting again that fast tumbling spins, such as those in pure water, have similar T1 and T2 relaxation times,[6] while slow tumbling spins, such as those in crystal lattices, have very distinct relaxation times.
Measurement
A spin echo experiment can be used to reverse time-invariant dephasing phenomena such as millimeter-scale magnetic inhomogeneities.[6] The resulting signal decays exponentially as the echo time (TE), i.e., the time after excitation at which readout occurs, increases. In more complicated experiments, multiple echoes can be acquired simultaneously in order to quantitatively evaluate one or more superimposed T2 decay curves.[6] In MRI, T2-weighted images can be obtained by selecting an echo time on the order of the various tissues' T2s.[8] In order to reduce the amount of T1 information and therefore contamination in the image, excited spins are allowed to return to near-equilibrium on a T1 scale before being excited again. (In MRI parlance, this waiting time is called the "repetition time" and is abbreviated TR). Pulse sequences other than the conventional spin echo can also be used to measure T2; gradient echo sequences such as steady-state free precession (SSFP) and multiple spin echo sequences can be used to accelerate image acquisition or inform on additional parameters.[6][8]
See also
References
- ↑ Abragam, A. (1961). Principles of Nuclear Magnetism. Clarendon Press. p. 15. ISBN 019852014X.
- ↑ Claridge, Timothy D.W. (2016). High Resolution NMR Techniques in Organic Chemistry, 3rd ed. Elsevier. p. 26-30. ISBN 978-0080999869.
- ↑ Levitt, Malcolm H. (2016). Spin Dynamics: Basics of Nuclear Magnetic Resonance 2nd Edition. Wiley. ISBN 978-0470511176.
- 1 2 3 Chavhan, Govind; Babyn, Paul; Thomas, Bejoy; Shroff, Manohar; Haacke, Mark (September 2009). "Principles, Techniques, and Applications of T2*-based MR Imaging and Its Special Applications". RadioGraphics. 29 (5): 1433–1449. doi:10.1148/rg.295095034. PMC 2799958. PMID 19755604.
- ↑ Becker, Edwin (October 1999). High Resolution NMR (3rd ed.). San Diego, California: Academic Press. p. 209. ISBN 978-0-12-084662-7. Retrieved 8 May 2019.
- 1 2 3 4 5 6 7 8 Becker, Edwin (October 1999). High Resolution NMR (3rd ed.). San Diego, California: Academic Press. p. 228. ISBN 978-0-12-084662-7. Retrieved 8 May 2019.
- ↑ Yury, Shapiro (September 2011). "Structure and dynamics of hydrogels and organogels: An NMR spectroscopy approach". Progress in Polymer Science. 36 (9): 1184–1253. doi:10.1016/j.progpolymsci.2011.04.002.
- 1 2 Basser, Peter; Mattiello, James; LeBihan, Denis (January 1994). "MR diffusion tensor spectroscopy and imaging". Biophysical Journal. 66 (1): 259–267. Bibcode:1994BpJ....66..259B. doi:10.1016/S0006-3495(94)80775-1. PMC 1275686. PMID 8130344.
- Ray Freeman (1999). Spin Choreography: Basic Steps in High Resolution NMR. Oxford University Press. ISBN 978-0-19-850481-8.
- Malcolm H. Levitt (2001). Spin Dynamics: Basics of Nuclear Magnetic Resonance. Wiley. ISBN 978-0-471-48922-1.
- Arthur Schweiger; Gunnar Jeschke (2001). Principles of Pulse Electron Paramagnetic Resonance. Oxford University Press. ISBN 978-0-19-850634-8.
- McRobbie D., et al. MRI, From picture to proton. 2003
- Hashemi Ray, et al. MRI, The Basics 2ED. 2004.