South Taranaki District | |
|---|---|
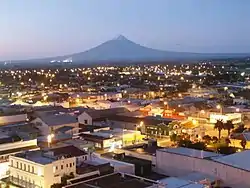
 Hāwera | |
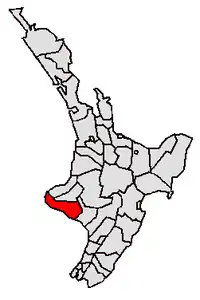
 Location of the South Taranaki District in North Island | |
| Coordinates: 39°29′35″S 174°26′49″E / 39.493°S 174.447°E | |
| Country | New Zealand |
| Region | Taranaki |
| Wards |
|
| Government | |
| • Mayor | Phil Nixon |
| • Deputy Mayor | Robert Northcott |
| • Territorial authority | South Taranaki District Council |
| Area | |
| • Land | 3,575.08 km2 (1,380.35 sq mi) |
| Population (June 2023)[2] | |
| • Total | 29,600 |
| Time zone | UTC+12 (NZST) |
| • Summer (DST) | UTC+13 (NZDT) |
| Postcode(s) | |
South Taranaki is a territorial authority on the west coast of New Zealand's North Island that contains the towns of Hāwera (the seat of the district), Manaia, Ōpunake, Patea, Eltham, and Waverley. The District has a land area of 3,575.46 km2 (1,380.49 sq mi) and a population of 29,600 (June 2023).[2] It is part of the greater Taranaki Region.
The district straddles the boundary separating the Wellington and Taranaki provinces, resulting in the town of Waverley celebrating Wellington Anniversary Day in January, and the town of Patea 15 kilometres away celebrating Taranaki Anniversary Day in March.
Council facilities include the South Taranaki LibraryPlus, Mania, Kaponga, Patea, Eltham, Opunake, Hāwera and Waverley libraries.[3]
History
The South Taranaki District was established as part of the 1989 local government reforms, merging Egmont, Eltham, Hawera, Patea and Waimate West counties.[4]
Demographics
South Taranaki District covers 3,575.08 km2 (1,380.35 sq mi)[1] and had an estimated population of 29,600 as of June 2023,[2] with a population density of 8.3 people per km2.
| Year | Pop. | ±% p.a. |
|---|---|---|
| 2006 | 26,487 | — |
| 2013 | 26,580 | +0.05% |
| 2018 | 27,534 | +0.71% |
| Source: [5] | ||
South Taranaki District had a population of 27,534 at the 2018 New Zealand census, an increase of 954 people (3.6%) since the 2013 census, and an increase of 1,047 people (4.0%) since the 2006 census. There were 10,668 households, comprising 13,971 males and 13,566 females, giving a sex ratio of 1.03 males per female. The median age was 38.5 years (compared with 37.4 years nationally), with 6,219 people (22.6%) aged under 15 years, 4,719 (17.1%) aged 15 to 29, 12,264 (44.5%) aged 30 to 64, and 4,332 (15.7%) aged 65 or older.
Ethnicities were 80.6% European/Pākehā, 27.6% Māori, 2.2% Pacific peoples, 3.4% Asian, and 1.8% other ethnicities. People may identify with more than one ethnicity.
The percentage of people born overseas was 8.9, compared with 27.1% nationally.
Although some people chose not to answer the census's question about religious affiliation, 51.0% had no religion, 35.8% were Christian, 1.9% had Māori religious beliefs, 0.7% were Hindu, 0.3% were Muslim, 0.3% were Buddhist and 1.4% had other religions.
Of those at least 15 years old, 2,007 (9.4%) people had a bachelor's or higher degree, and 6,162 (28.9%) people had no formal qualifications. The median income was $28,800, compared with $31,800 nationally. 2,862 people (13.4%) earned over $70,000 compared to 17.2% nationally. The employment status of those at least 15 was that 10,398 (48.8%) people were employed full-time, 3,051 (14.3%) were part-time, and 942 (4.4%) were unemployed.[5]
| Name | Area (km2) | Population | Density (per km2) | Households | Median age | Median income |
|---|---|---|---|---|---|---|
| Egmont Plains Ward[lower-alpha 1] | 860.42 | 6,345 | 7.37 | 2,412 | 36.4 years | $29,900 |
| Eltham Ward[lower-alpha 2] | 538.17 | 4,029 | 26.07 | 1,557 | 37.2 years | $28,000 |
| Tangahoe Ward[lower-alpha 3] | 491.32 | 2,859 | 5.82 | 1,053 | 38.2 years | $40,100 |
| Hawera-Normanby Ward[lower-alpha 3] | 17.27 | 10,413 | 602.95 | 4,011 | 38.8 years | $27,900 |
| Patea Ward[lower-alpha 4] | 1,667.96 | 3,891 | 2.33 | 1,635 | 43.2 years | $24,000 |
| New Zealand | 37.4 years | $31,800 |
Government
The current mayor is Phil Nixon.[6] The deputy mayor is Robert Northcott.[7]
References
- 1 2 "ArcGIS Web Application". statsnz.maps.arcgis.com. Retrieved 5 March 2022.
- 1 2 3 "Subnational population estimates (RC, SA2), by age and sex, at 30 June 1996-2023 (2023 boundaries)". Statistics New Zealand. Retrieved 25 October 2023. (regional councils); "Subnational population estimates (TA, SA2), by age and sex, at 30 June 1996-2023 (2023 boundaries)". Statistics New Zealand. Retrieved 25 October 2023. (territorial authorities); "Subnational population estimates (urban rural), by age and sex, at 30 June 1996-2023 (2023 boundaries)". Statistics New Zealand. Retrieved 25 October 2023. (urban areas)
- ↑ "South Taranaki LibraryPlus". South Taranaki District Council. Retrieved 9 February 2016.
- ↑ "Determination of representation arrangements to apply for the election of South Taranaki District Council to be held on 12 October 2019" (PDF). Local Government Commission. Retrieved 1 February 2021.
- 1 2 "Statistical area 1 dataset for 2018 Census". Statistics New Zealand. March 2020. South Taranaki District (035). 2018 Census place summary: South Taranaki District
- ↑ "Mayor of South Taranaki". South Taranaki District Council. Retrieved 13 December 2019.
- ↑ "South Taranaki District Councillors". South Taranaki District Council. Retrieved 13 December 2019.