Saint-Maurice-de-Beynost | |
|---|---|
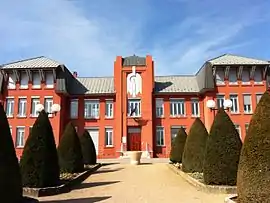
 Town hall | |
.svg.png.webp) Coat of arms | |
Location of Saint-Maurice-de-Beynost | |
 Saint-Maurice-de-Beynost  Saint-Maurice-de-Beynost | |
| Coordinates: 45°50′00″N 4°58′00″E / 45.8333°N 4.9667°E | |
| Country | France |
| Region | Auvergne-Rhône-Alpes |
| Department | Ain |
| Arrondissement | Bourg-en-Bresse |
| Canton | Miribel |
| Intercommunality | CC de Miribel et du Plateau |
| Government | |
| • Mayor (2020–2026) | Pierre Goubet[1] |
| Area 1 | 6.99 km2 (2.70 sq mi) |
| Population | 4,155 |
| • Density | 590/km2 (1,500/sq mi) |
| Time zone | UTC+01:00 (CET) |
| • Summer (DST) | UTC+02:00 (CEST) |
| INSEE/Postal code | 01376 /01700 |
| Elevation | 172–315 m (564–1,033 ft) (avg. 200 m or 660 ft) |
| 1 French Land Register data, which excludes lakes, ponds, glaciers > 1 km2 (0.386 sq mi or 247 acres) and river estuaries. | |
Saint-Maurice-de-Beynost (French pronunciation: [sɛ̃ mɔʁis də beno] ⓘ; literally "Saint-Maurice of Beynost") is a commune in the Ain department, in the Auvergne-Rhône-Alpes region, located at about 15 km (9 mi) from Lyon.
The commune is included in the canton of Miribel and in the intercommunality of communauté de communes de Miribel et du Plateau.
A small farming village at the beginning of the 20th century, the commune of Saint-Maurice-de-Beynost became an industrial town in the 1920s, following the construction of the second textile factory of the "Lyon Society of Artificial Silk". The need for workers in this factory led to a quadrupling of the population in just five years, between 1926 and 1931. Today, the factory, which belongs to the Japanese group Toray Industries, is still the main employer in the city with nearly five hundred employees.
The inhabitants of Saint-Maurice-de-Beynost are called Mauriciens.
Population
|
| ||||||||||||||||||||||||||||||||||||||||||||||||||||||||||||||||||||||||||||||||||||||||||||||||||||||||||||||||||
| Source: EHESS[3] and INSEE (1968-2017)[4] | |||||||||||||||||||||||||||||||||||||||||||||||||||||||||||||||||||||||||||||||||||||||||||||||||||||||||||||||||||
Sports
- Ain Sud Foot, football
See also
References
- ↑ "Répertoire national des élus: les maires". data.gouv.fr, Plateforme ouverte des données publiques françaises (in French). 2 December 2020.
- ↑ "Populations légales 2021". The National Institute of Statistics and Economic Studies. 28 December 2023.
- ↑ Des villages de Cassini aux communes d'aujourd'hui: Commune data sheet Saint-Maurice-de-Beynost, EHESS (in French).
- ↑ Population en historique depuis 1968, INSEE