| New York's 20th congressional district | |||
|---|---|---|---|
Interactive map of district boundaries since January 3, 2023 | |||
| Representative |
| ||
| Distribution |
| ||
| Population (2022) | 781,546 | ||
| Median household income | $79,758[1] | ||
| Ethnicity |
| ||
| Cook PVI | D+7[2] | ||
New York's 20th congressional district is a congressional district for the United States House of Representatives in New York's Capital District. It includes all of Albany, Saratoga, and Schenectady counties, and portions of Rensselaer county.
Recent statewide election results
| Year | Office | Results |
|---|---|---|
| 1992 | President | Clinton 45–41% |
| 1996 | President | Clinton 54–37% |
| 2000 | President | Bush 51–44% |
| 2004 | President | Bush 54–46% |
| 2008 | President | Obama 51–46% |
| 2012 | President | Obama 59–38% |
| 2016 | President | Clinton 54–40% |
| 2020 | President | Biden 59–38% |
History

.tif.png.webp)
- 1825–?: (two seats) comprising St. Lawrence, Jefferson, Lewis and Oswego counties.
- 1875–1893: Montgomery
- 1913–1973: Parts of Manhattan
- 1973–1983: Parts of Bronx, Manhattan
- 1983–1993: Parts of Westchester
- 1993–2003: All of Rockland, Parts of Orange, Sullivan, Westchester
- 2003–2013: All of Columbia, Greene, Warren, Washington, Parts of Delaware, Dutchess, Essex, Otsego, Rensselaer, Saratoga
- 2013–2023: All of Albany, Schenectady, Parts of Montgomery, Rensselaer, Saratoga
- 2023–present: All of Albany, Saratoga, Schenectady, Parts of Rensselaer
Various New York districts have been numbered "20" over the years, including areas in New York City and various parts of upstate New York.
List of members representing the district
1813–1833: two seats
From the creation of the district in 1813 to 1833, two seats were apportioned, elected at-large on a general ticket.
| Years | Cong ress |
Seat A | Seat B | ||||||
|---|---|---|---|---|---|---|---|---|---|
| Representative | Party | Electoral history | Representative | Party | Electoral history | ||||
| March 4, 1813 – March 3, 1815 |
13th | Daniel Avery (Aurora) |
Democratic-Republican | Redistricted from the 14th district and re-elected in 1812. [data missing] |
 Oliver C. Comstock (Trumansburg) |
Democratic-Republican | Elected in 1812. Re-elected in 1814. Re-elected in 1816. [data missing] | ||
| March 4, 1815 – June 4, 1816 |
14th | 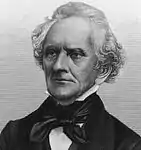 Enos T. Throop (Auburn) |
Democratic-Republican | Re-elected in 1814. Lost re-election and resigned early. | |||||
| June 4, 1816 – September 30, 1816 |
Vacant | ||||||||
| September 30, 1816 – March 3, 1817 |
Daniel Avery (Aurora) |
Democratic-Republican | Elected in September 1816 to finish Porter's term and seated December 3, 1816. Retired. | ||||||
| March 4, 1817 – March 3, 1819 |
15th | Daniel Cruger (Bath) |
Democratic-Republican | Elected in 1816. [data missing] | |||||
| March 4, 1819 – March 3, 1821 |
16th | Caleb Baker (Elmira) |
Democratic-Republican | Elected in 1818. [data missing] |
Jonathan Richmond (Aurora) |
Democratic-Republican | Elected in 1818. Lost re-election. | ||
| March 4, 1821 – December 3, 1821 |
17th | Vacant | Elections were held in April 1821. It is unclear when results were announced or credentials issued. | Vacant | Elections were held in April 1821. It is unclear when results were announced or credentials issued. | ||||
| December 3, 1821 – March 3, 1823 |
William B. Rochester (Bath) |
Democratic-Republican | Elected in 1821. Redistricted to the 28th district. |
 David Woodcock (Ithaca) |
Democratic-Republican | Elected in 1821. Resigned to become judge of the Eight Circuit Court | |||
| March 4, 1823 – March 3, 1825 |
18th |  Ela Collins (Lowville) |
Democratic-Republican | Elected in 1822. [data missing] |
Egbert Ten Eyck (Watertown) |
Democratic-Republican | Elected in 1822. Re-elected in 1824. Lost election contest. | ||
| March 4, 1825 – December 15, 1825 |
19th | Nicoll Fosdick (Morristown) |
Anti-Jacksonian | Elected in 1824. Lost re-election. |
Jacksonian | ||||
| December 15, 1825 – March 3, 1827 |
Daniel Hugunin Jr. (Oswego) |
Anti-Jacksonian | Successfully contested election of Egbert Ten Eyck. | ||||||
| March 4, 1827 – February 16, 1829 |
20th | Rudolph Bunner (Oswego) |
Jacksonian | Elected in 1826. Retired. |
 Silas Wright (Canton) |
Jacksonian | Elected in 1826. Lost re-election then resigned. | ||
| February 16, 1829 – March 3, 1829 |
Vacant | ||||||||
| March 4, 1829 – February 5, 1830 |
21st | Joseph Hawkins (Henderson) |
Anti-Jacksonian | Elected in 1828. [data missing] |
George Fisher (Oswego) |
Anti-Jacksonian | Elected in 1828. Election successfully contested by Silas Wright, but declined to qualify | ||
| February 5, 1830 – November 3, 1830 |
Vacant | ||||||||
| November 3, 1830 – March 3, 1831 |
.jpg.webp) Jonah Sanford (Oswego) |
Jacksonian | Elected to finish Fisher/Wright's term. Retired. | ||||||
| March 4, 1831 – March 3, 1833 |
22nd | .jpg.webp) Charles Dayan (Lowville) |
Jacksonian | Elected in 1830. [data missing] |
.jpg.webp) Daniel Wardwell (Mannsville) |
Jacksonian | Elected in 1830. Redistricted to the 18th district. | ||
1833–present: one seat
Election results
In New York State electoral politics there are numerous minor parties at various points on the political spectrum. Certain parties will invariably endorse either the Republican or Democratic candidate for every office, hence the state electoral results contain both the party votes, and the final candidate votes (Listed as "Recap").
| Party | Candidate | Votes | % | ±% | |
|---|---|---|---|---|---|
| Republican | Benjamin A. Gilman (incumbent) | 122,479 | 57.1% | ||
| Democratic | Yash A. Aggarwal | 80,761 | 37.6% | ||
| Right to Life | Robert F. Garrison | 6,356 | 3.0% | ||
| Independence | Ira W. Goodman | 5,016 | 2.3% | ||
| Majority | 41,718 | 19.4% | |||
| Turnout | 214,612 | 100% | |||
| Party | Candidate | Votes | % | ±% | |
|---|---|---|---|---|---|
| Republican | Benjamin A. Gilman (incumbent) | 98,546 | 58.3% | +1.2% | |
| Democratic | Paul J. Feiner | 65,589 | 38.8% | +1.2% | |
| Right to Life | Christine M. Tighe | 4,769 | 2.8% | −0.2% | |
| Majority | 32,957 | 19.5% | +0.1% | ||
| Turnout | 168,904 | 100% | −21.3% | ||
| Party | Candidate | Votes | % | ±% | |
|---|---|---|---|---|---|
| Republican | Benjamin A. Gilman (incumbent) | 136,016 | 57.6% | −0.7% | |
| Democratic | Paul J. Feiner | 94,646 | 40.1% | +1.3% | |
| Right to Life | Christine M. Tighe | 5,371 | 2.3% | −0.5% | |
| Majority | 41,370 | 17.5% | −2.0% | ||
| Turnout | 236,033 | 100% | +39.7% | ||
| Party | Candidate | Votes | % | ±% | |
|---|---|---|---|---|---|
| Republican | John E. Sweeney | 140,238 | 73.3% | +15.7% | |
| Democratic | Frank Stoppenbach | 45,878 | 24.0% | −16.1% | |
| Green | Margaret Lewis | 5,162 | 2.7% | +2.7% | |
| Majority | 94,360 | 49.3% | +31.8% | ||
| Turnout | 191,278 | 100% | −19.0% | ||
| Party | Candidate | Votes | % | ±% | |
|---|---|---|---|---|---|
| Republican | John E. Sweeney (incumbent) | 188,753 | 65.8% | −7.5% | |
| Democratic | Doris F. Kelly | 96,630 | 33.7% | +9.7% | |
| Centrist Party | Morris N. Guller | 1,353 | 0.5% | +0.5% | |
| Majority | 92,123 | 32.1% | −17.2% | ||
| Turnout | 286,736 | 100% | +49.9% | ||
| Party | Candidate | Votes | % | ±% | |
|---|---|---|---|---|---|
| Democratic | Kirsten Gillibrand | 125,168 | 53.1% | +19.4% | |
| Republican | John E. Sweeney (incumbent) | 110,554 | 46.9% | −18.9% | |
| Majority | 14,614 | 6.2% | −25.9% | ||
| Turnout | 235,722 | 100% | −17.8% | ||
| Party | Candidate | Votes | % | ±% | |
|---|---|---|---|---|---|
| Democratic | Kirsten Gillibrand (incumbent) | 177,677 | 61.8% | +8.7% | |
| Republican | Sandy Treadwell | 109,644 | 38.2% | −8.7% | |
| Majority | 68,033 | 23.6% | +17.4% | ||
| Turnout | 287,321 | 100% | +21.9% | ||
| Party | Candidate | Votes | % | ±% | |
|---|---|---|---|---|---|
| Democratic | Scott Murphy | 80,833 | 50.23% | −11.57% | |
| Republican | James Tedisco | 80,107 | 49.77% | +11.57% | |
| Majority | 726 | 0.45% | −23.15% | ||
| Turnout | 160,940 | 100% | −44.0% | ||
| Party | Candidate | Votes | % | ±% | |
|---|---|---|---|---|---|
| Republican | Chris Gibson | 130,176 | 54.87% | +5.10% | |
| Democratic | Scott Murphy (incumbent) | 107,077 | 45.13% | −5.10% | |
| Majority | 23,099 | 9.74% | +9.29% | ||
| Turnout | 237,253 | 100% | +47.4% | ||
| Party | Candidate | Votes | % | ±% | |
|---|---|---|---|---|---|
| Democratic | Paul Tonko | 203,401 | 68.44% | +23.3% | |
| Republican | Robert J. Dieterich | 93,778 | 31.56% | −23.3% | |
| Majority | 109,623 | 36.89% | +27.2% | ||
| Turnout | 313,024 | 100% | +31.93% | ||
| Party | Candidate | Votes | % | ±% | |
|---|---|---|---|---|---|
| Democratic | Paul Tonko (incumbent) | 125,111 | 61.26% | −7.18% | |
| Republican | James M. Fischer | 79,104 | 38.74% | +7.18% | |
| Majority | 46007 | 22.53% | −14.36% | ||
| Turnout | 171,118 | 100% | −45.33% | ||
| Party | Candidate | Votes | % | ±% | |
|---|---|---|---|---|---|
| Democratic | Paul Tonko (incumbent) | 213,018 | 67.89% | +6.63% | |
| Republican | Joe Vitollo | 100,740 | 32.11% | −6.63% | |
| Majority | 112,278 | 35.78% | +13.25% | ||
| Turnout | 325,296 | 100% | +90.10% | ||
| Party | Candidate | Votes | % | ±% | |
|---|---|---|---|---|---|
| Democratic | Paul Tonko (incumbent) | 176,811 | 66.50% | −1.39% | |
| Republican | Joe Vitollo | 89,058 | 33.50% | +1.39% | |
| Majority | 87,753 | 33.01% | −2.77% | ||
| Turnout | 264,564 | 100% | −18.67% | ||
| Party | Candidate | Votes | % | |
|---|---|---|---|---|
| Democratic | Paul Tonko | 194,071 | 54.0 | |
| Working Families | Paul Tonko | 19,678 | 5.5 | |
| Independence | Paul Tonko | 5,956 | 1.7 | |
| Total | Paul Tonko (incumbent) | 219,705 | 61.2 | |
| Republican | Liz Joy | 120,839 | 33.6 | |
| Conservative | Liz Joy | 17,849 | 5.0 | |
| SAM | Liz Joy | 758 | 0.2 | |
| Total | Liz Joy | 139,446 | 38.8 | |
| Total votes | 359,151 | 100.0 | ||
| Democratic hold | ||||
Notes
- 1 2 In 1924, La Guardia ran for re-election on the Socialist line after refusing the Republican nomination in order to endorse Robert M. LaFollette's presidential campaign.
See also
References
- ↑ Center for New Media & Promotion (CNMP), US Census Bureau. "My Congressional District". www.census.gov.
- ↑ "2022 Cook PVI: District Map and List". Cook Political Report. Retrieved January 10, 2023.
- ↑ Neuman, William (November 5, 2008). "Election Results 2008: New York". New York Times. Archived from the original on December 17, 2008. Retrieved December 6, 2008.
- ↑ "Statement of Canvass: 20th Congressional District" (PDF). New York State Board of Elections. May 2009. Archived (PDF) from the original on November 5, 2013. Retrieved May 15, 2009.
- ↑ "Archived copy" (PDF). Archived (PDF) from the original on August 23, 2012. Retrieved July 24, 2012.
{{cite web}}: CS1 maint: archived copy as title (link) 2010 election results - ↑ "NYS Board of Elections Rep. in Congress Election Returns Nov. 6, 2012" (PDF). Retrieved June 4, 2020. 2012 election results
- ↑ "NYS Board of Elections Rep. in Congress Election Returns November 4, 2014" (PDF). Retrieved June 4, 2020. 2014 election results
- ↑ "NYS Board of Elections Rep. in Congress Election Returns Nov. 8, 2016" (PDF). Retrieved June 4, 2020. 2016 election results
- ↑ "Certified Results from the November 6, 2018 General Election for U.S. Congress" (PDF). Retrieved June 4, 2020. 2018 election results
- Martis, Kenneth C. (1989). The Historical Atlas of Political Parties in the United States Congress. New York: Macmillan Publishing Company.
- Martis, Kenneth C. (1982). The Historical Atlas of United States Congressional Districts. New York: Macmillan Publishing Company.
- Congressional Biographical Directory of the United States 1774–present
- 2004 House election data Clerk of the House of Representatives
- 2002 House election data
- 2000 House election data
- 1998 House election data
- 1996 House election data
.svg.png.webp)
.jpg.webp)
.jpg.webp)
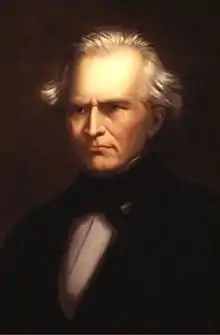


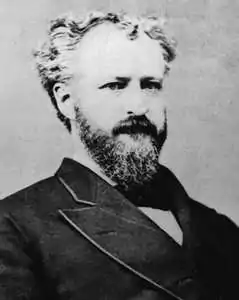
.jpg.webp)


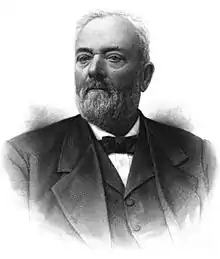


.jpg.webp)




.jpg.webp)
.jpg.webp)






_(since_2023).svg.png.webp)