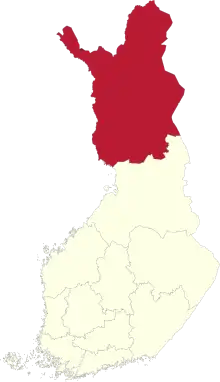
| Constituency for the Eduskunta | |
 | |
| Region | Lapland |
|---|---|
| Population | 180,231 (2016) |
| Current constituency | |
| Created | 1939 |
| Seats | 6 |
Lapland is a Finnish constituency represented in the eduskunta. It covers the administrative region of Lapland, with a population, as of its most recent accessible calculation in 2002, of 187,777. Lapland currently elects seven members to the eduskunta.The constituency is largely rural, and the only cities in the area are small. Thus, the dominant party has traditionally been the rural Centre Party. The second party that holds major influence in the area is the SKDL/Left Alliance. The other two major Finnish parties, the social democratic SDP and conservative NCP have usually received one of the seats in the constituency. The NCP has often allied with the Christian Democrats.
Members of Parliament
| Election | Member (Party) |
Member (Party) |
Member (Party) |
Member (Party) |
Member (Party) |
Member (Party) |
Member (Party) | |||||||
|---|---|---|---|---|---|---|---|---|---|---|---|---|---|---|
| April 2015 |
Katri Kulmuni (Centre) |
Markus Lohi (Centre) |
Mikko Kärnä (Centre) |
Eeva-Maria Maijala (Centre) |
Johanna Ojala-Niemelä (Social Democrats) |
Hanna Mäntylä (True Finns) |
Markus Mustajärvi (Left Alliance) | |||||||
| July 2017 co-option |
Matti Torvinen (Blue Reform) | |||||||||||||
| April 2019 |
Heikki Autto (National Coalition) |
Kaisa Juuso (Finns Party) | ||||||||||||
| April 2023 |
Sara Seppänen (Finns Party) |
Seat abolished 6 seats | ||||||||||||
Election results
| 2003 Finnish parliamentary election | |||||||||
|---|---|---|---|---|---|---|---|---|---|
| Party | Seats | Net gain/loss | Seats % | Votes % | Votes | +/− | |||
| Centre | 3 | -1 | 42.9 | 44.8 | 45,696 | +2.0% | |||
| Left Alliance | 2 | 0 | 28.9 | 25.6 | 26,067 | -1.5% | |||
| SDP | 1 | 0 | 14.3 | 14.5 | 14,732 | +1.1% | |||
| National Coalition | 1 | 0 | 14.3 | 10.2 | 10,406 | +0.2% | |||
| VIHR | 0 | 0 | 0.0 | 2.1 | 2,152 | +0.3% | |||
| other groups | 0 | 0 | 0.0 | 2.7 | 2,877 | n/a | |||
| 2019 Finnish parliamentary election[1] | |||||||||
|---|---|---|---|---|---|---|---|---|---|
| Party | Seats | Net gain/loss | Seats % | Votes % | Votes | +/− | |||
| Centre | 3 | -1 | 42.9 | 29.2 | 29,145 | -13.7% | |||
| Finns | 1 | 0 | 14.3 | 17.2 | 17,160 | +0.7% | |||
| Left Alliance | 1 | 0 | 14.3 | 14.2 | 14,128 | +0.4% | |||
| SDP | 1 | 0 | 14.3 | 13.5 | 13,479 | +2.7% | |||
| National Coalition | 1 | +1 | 14.3 | 11.3 | 11,243 | +1.2% | |||
| VIHR | 0 | 0 | 0.0 | 9.7 | 9,706 | +7.1% | |||
| other groups | 0 | 0 | 0.0 | 4.9 | 4,946 | n/a | |||
| 2023 Finnish parliamentary election[2] | |||||||||
|---|---|---|---|---|---|---|---|---|---|
| Party | Seats | Net gain/loss | Seats % | Votes % | Votes | +/− | |||
| Finns | 2 | +1 | 33.3 | 26.8 | 26,199 | +9.6% | |||
| Centre | 2 | -1 | 33.3 | 24.8 | 24,321 | -4.4% | |||
| SDP | 1 | 0 | 16.7 | 18.1 | 17,685 | +4.6% | |||
| National Coalition | 1 | 0 | 16.7 | 12.2 | 11,978 | +1.0% | |||
| Left Alliance | 1 | -1 | 0.0 | 9.9 | 9,731 | -4.2% | |||
| VIHR | 0 | 0 | 0.0 | 3.5 | 3,386 | -6.3% | |||
| other groups | 0 | 0 | 0.0 | 4.7 | 4,604 | n/a | |||
References
- ↑ "Electoral district of Lapland: Results by party and by joint list". Ministry of Justice. 18 April 2019. Retrieved 19 April 2019.
- ↑ "Electoral district of Lapland: Results by party and by joint list". Ministry of Justice. 15 May 2019. Retrieved 16 June 2023.
See also
This article is issued from Wikipedia. The text is licensed under Creative Commons - Attribution - Sharealike. Additional terms may apply for the media files.